IV · THE GAME · MAJOR LEAGUE BASEBALL
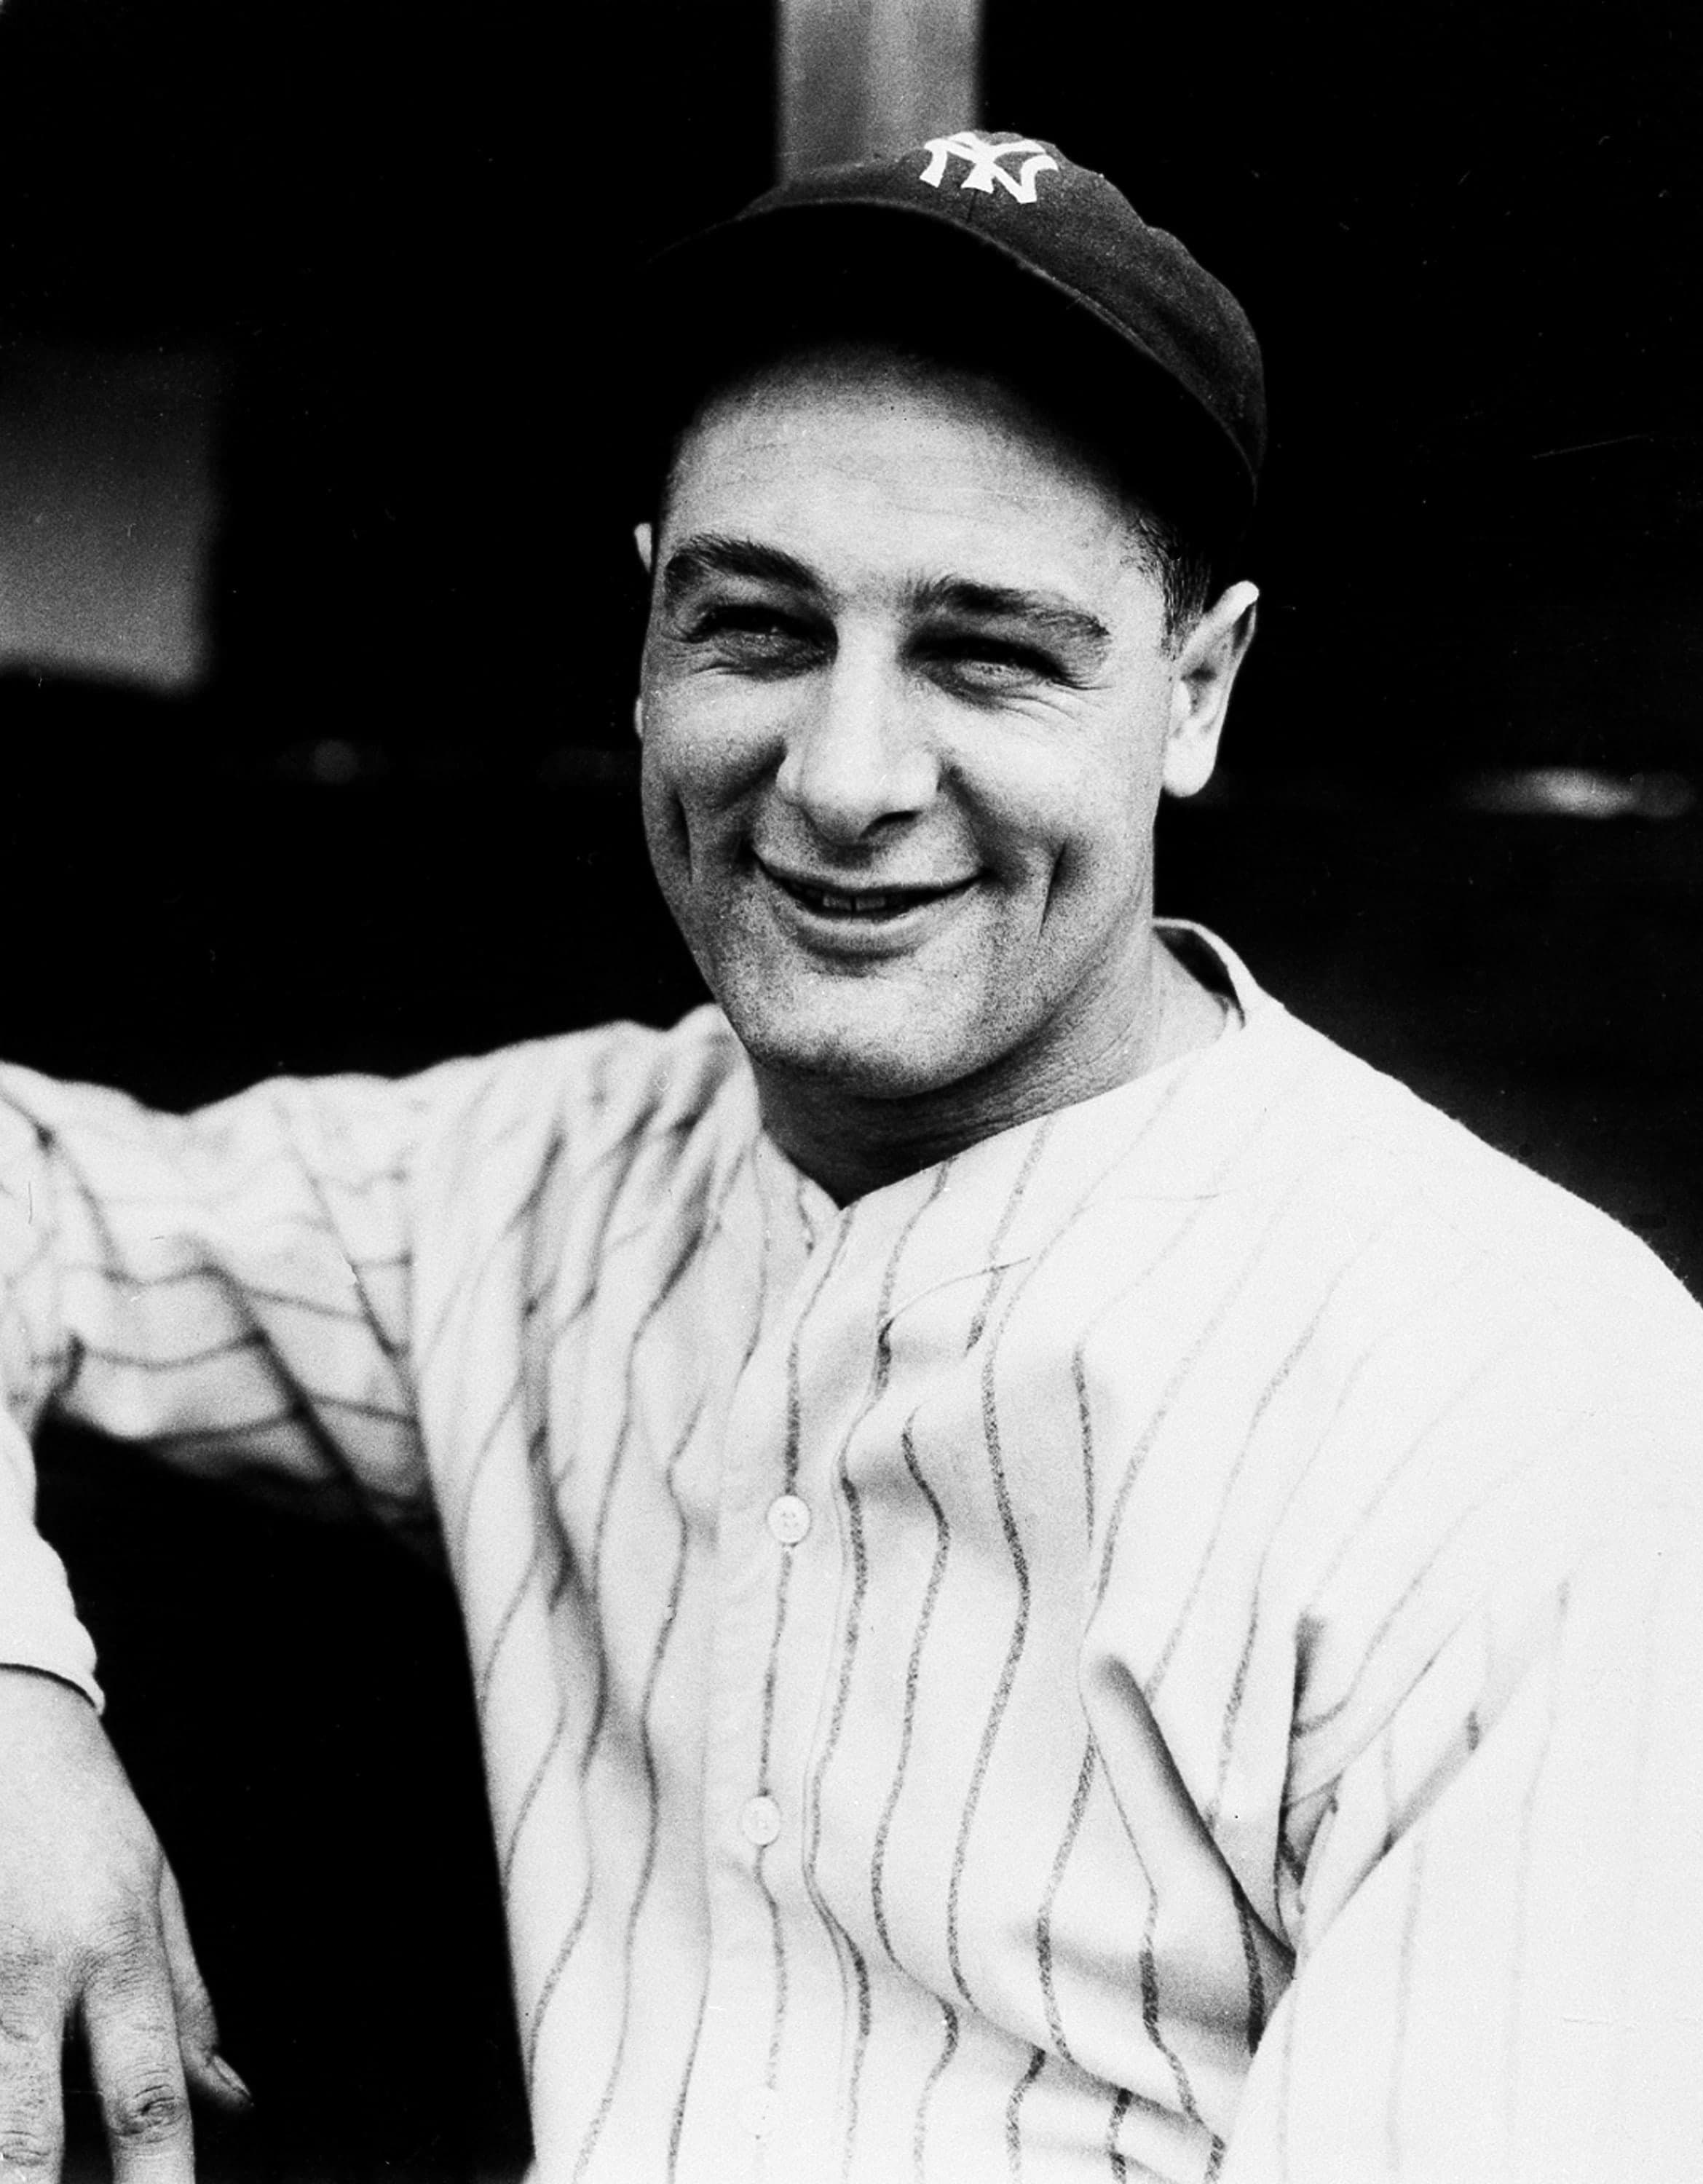
Lou Gehrig
A career that ran from 1923 to 1939 looks like a gentle slope until the final line of the table, when everything that had been consistent for sixteen years stopped being so.
At a glance
- Career
- 2,164 games · 2,721 hits · 493 home runs · 1,995 runs batted in · .340 average
- Debut
- 15 June 1923, aged 19, at Yankee Stadium
- Last game
- 30 April 1939, aged 35
- Seasons
- 17, all with the New York Yankees
Look closer
The debut was a rout, and the visiting side made five errors
On 15 June 1923 the Yankees and the St. Louis Browns each made ten hits and seven hits respectively, but the final score was 10–0. The Browns made five errors to the Yankees' one, which is the size of half the margin. The Yankees scored three in the first inning and six in the second — nine of the ten runs arrived before the third inning began. St. Louis never scored, which is why the ninth inning for the home side shows a dash rather than a nought: the bottom half was not played.
The first two seasons were thirteen games and ten games
In 1923 he appeared in thirteen games, made twenty-six at-bats, and hit .423. In 1924 he appeared in ten games, made twelve at-bats, and hit .500. Neither season resembles what followed. In 1925 the games played jumped to one hundred and twenty-six, the at-bats to four hundred and thirty-seven, and the average fell to .295. That third season is the shape the rest of the career took: between one hundred and twenty-six and one hundred and fifty-seven games every year from 1925 through 1938.
The 1939 season was eight games, then nothing
Every season from 1925 to 1938 shows between one hundred and twenty-six and one hundred and fifty-seven games played. The 1939 line shows eight. The at-bats dropped from five hundred and seventy-six to twenty-eight, the hits from one hundred and seventy to four, the average from .295 to .143. He drew five walks in those eight games, struck out once, and drove in one run. No other season in the table prepares you for that final line.
The story
On 15 June 1923, in front of ten thousand people at Yankee Stadium, the New York Yankees beat the St. Louis Browns 10–0. The Yankees made ten hits, the Browns seven. The difference was errors: St. Louis made five, New York one. The Yankees scored three runs in the first inning and six in the second, so nine of the ten were on the board before the third inning began. The Browns never scored, which is why the home half of the ninth shows a dash — when the home side is ahead, it does not bat.
That was the debut. The player was nineteen years old. He appeared in thirteen games that season, made twenty-six at-bats, and hit .423. The following year he appeared in ten games, made twelve at-bats, and hit .500. Neither season looks like what came next.
In 1925 the games played jumped to one hundred and twenty-six, the at-bats to four hundred and thirty-seven, and the average fell to .295. That is the shape the career took: between one hundred and twenty-six and one hundred and fifty-seven games every season from 1925 through 1938. The batting average over those years ranged from .295 to .379. The home runs ranged from sixteen to forty-nine. The runs batted in ranged from sixty-eight to one hundred and eighty-four. The on-base percentage never fell below .365 and reached .478 in 1936. The slugging percentage — total bases divided by at-bats, a measure of power — never fell below .523 and reached .765 in 1927.
Then the 1939 line. Eight games. Twenty-eight at-bats. Four hits. No home runs. One run batted in. An average of .143, an on-base percentage of .273, a slugging percentage of .143. He drew five walks and struck out once. Every other season in the table shows consistency; the final one shows a collapse. He was thirty-five years old. The last game was 30 April 1939.
The career totals are two thousand one hundred and sixty-four games, two thousand seven hundred and twenty-one hits, four hundred and ninety-three home runs, one thousand nine hundred and ninety-five runs batted in, and a batting average of .340. The on-base percentage was .447, the slugging percentage .632. He stole one hundred and two bases, drew one thousand five hundred and eight walks, and struck out seven hundred and ninety times. All of it across seventeen seasons, every one of them with the New York Yankees.
Why it mattered then
The numbers describe a player who was productive from the moment he became a regular in 1925 and remained so through 1938. The consistency matters because it was unusual: most careers show more variation, more seasons lost to injury or decline, more gaps. This one did not. From 1926 onward he appeared in at least one hundred and forty-nine games every season except 1939, when the total was eight. The at-bats, the hits, the runs batted in — all of them stayed within a predictable range. The power numbers rose through the late 1920s and early 1930s, peaked in 1927 and 1931 and 1934 and 1936, and remained high even in the seasons that were not peaks. The on-base and slugging percentages describe a hitter who was difficult to get out and who hit for extra bases when he made contact. The seventeen-year span, all with one club, was a long tenure by the standards of the era, and the fact that sixteen of those seventeen years look alike makes the final one more conspicuous. The collapse was sudden, not gradual, and it ended the career.
Why it matters now
The shape of the career — long, consistent, then abruptly over — is a pattern that appears in other contexts, and the table makes it visible. The 1939 line is the anomaly, but it is the anomaly that defines the story: without it, the career would have continued, or declined slowly, or ended for a different reason. Instead it stopped. The cause is not in the statistics, but the effect is. The numbers also describe a level of performance that was sustained across a span of time that most players do not reach. The career average of .340 is built from seventeen seasons, not a handful of good years followed by a long tail of declining production. The home run total of four hundred and ninety-three is built from seasons in which the high was forty-nine and the low, after 1925, was sixteen. The runs batted in total of one thousand nine hundred and ninety-five is built from seasons in which the high was one hundred and eighty-four and the low, after 1925, was sixty-eight. The consistency is the story, and the final line is the punctuation.
The surprising detail
The two seasons that sit oddest in the table are 1927 and 1939. In 1927 he played one hundred and fifty-five games, made five hundred and eighty-four at-bats, scored one hundred and forty-nine runs, made two hundred and eighteen hits, hit forty-seven home runs, drove in one hundred and seventy-five runs, and batted .373. In 1939 he played eight games, made twenty-eight at-bats, scored two runs, made four hits, hit no home runs, drove in one run, and batted .143. The gap between those two lines is twelve years, but the gap in performance is larger than twelve years of gradual decline would produce. The 1938 season, immediately before 1939, shows one hundred and fifty-seven games, five hundred and seventy-six at-bats, one hundred and seventy hits, twenty-nine home runs, one hundred and fourteen runs batted in, and a .295 average. That is the lowest average since 1925, but it is not a collapse. The collapse is the following year, and it is total.
What is disputed
Every figure here comes from the MLB Stats API. Statistical categories were not all recorded consistently across the seventeen seasons covered, and records for the 1920s and 1930s were compiled retrospectively from contemporary scoring; the totals are the ones the league publishes today rather than anything independently recomputed here.
Remember this
Seventeen seasons, sixteen of them consistent, and a final eight games in 1939 that resemble nothing that came before.
Test yourself
The 1927 season shows the highest batting average in the table, .373, and the 1938 season shows the lowest average in any full season, .295. What do the on-base percentages for those two years tell you about how the hitting was different?
In 1927 the on-base percentage was .474, and in 1938 it was .410. The gap between the two batting averages is .078, but the gap between the two on-base percentages is only .064, which means the 1938 season was closer to 1927 in terms of reaching base than it was in terms of hitting for average. The reason is walks: in 1927 he drew one hundred and nine walks, and in 1938 he drew one hundred and seven. The on-base percentage includes walks, so a player who walks frequently can have a lower batting average but still reach base at a rate that is not far off a higher-average season. The 1938 season was weaker in batting average but not weaker in discipline or in getting on base.
Go deeper
- Lou Gehrig — MLB Stats API player record · MLB Advanced Media
- Lou Gehrig — career hitting totals (MLB Stats API) · MLB Advanced Media
- Debut game linescore — MLB Stats API game 97349 · MLB Advanced Media
- Lou Gehrig — Wikidata · Wikidata
Image: Unknown author, Public domain. Licence: Public domain. Source.