IV · THE GAME · MAJOR LEAGUE BASEBALL
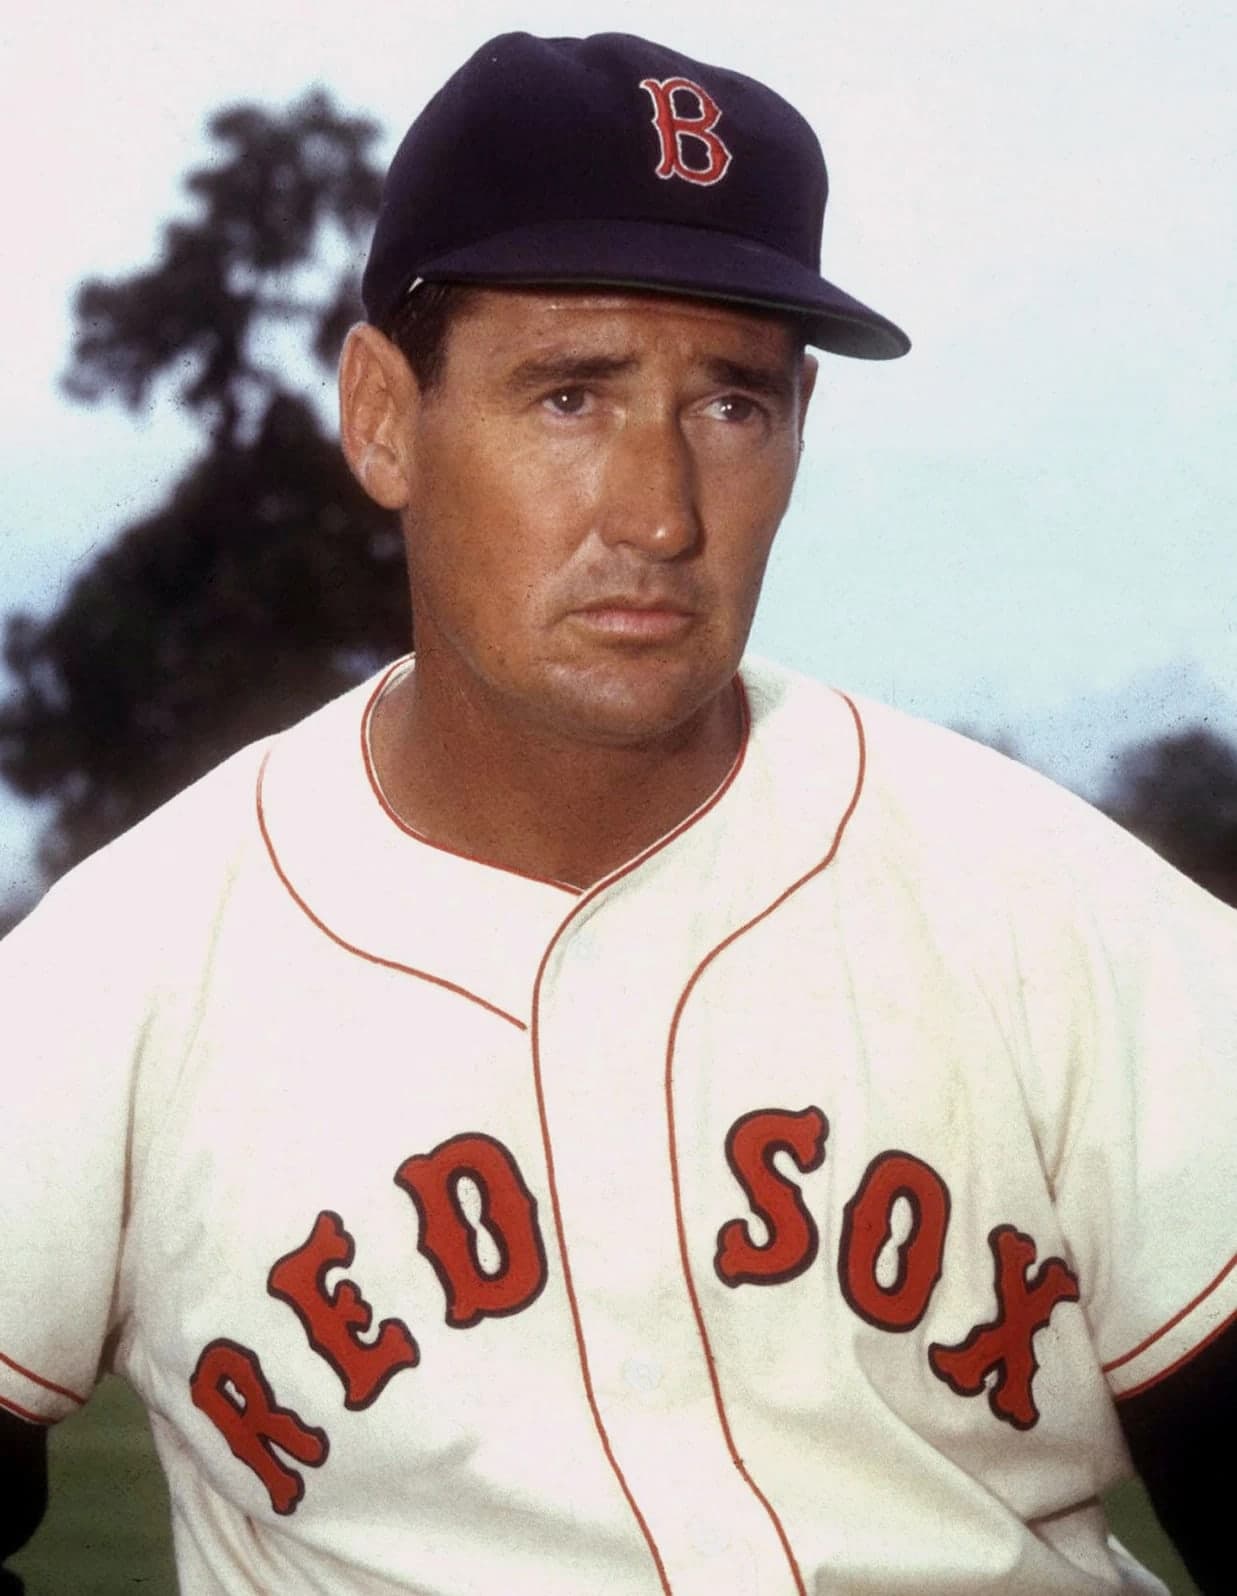
Ted Williams
He hit .406 in 1941 and .254 in 1959. The seasons sit in the same career, and the season table holds both of them without apology.
At a glance
- Career
- 2,292 games · 2,654 hits · 521 home runs · 1,839 runs batted in · .344 average
- Debut
- 20 April 1939, aged 20, at Yankee Stadium
- Last game
- 28 September 1960, for the Boston Red Sox
- On-base percentage
- .482 — 2,019 walks, 709 strikeouts
Look closer
The debut was a shutout, and the hits did not cluster
On 20 April 1939 the Red Sox and the Yankees each made seven hits. New York scored once in the second inning and once in the fifth; Boston did not score at all. Equal hits do not mean equal innings — the seven Boston hits were scattered across seven different frames, which is the least efficient distribution possible. New York made two errors to Boston's one, but the runs came home regardless. The game took two hours and four minutes in front of 30,278 people, and the home side did not bat in the ninth because they were already ahead.
The walk total is larger than the strikeout total
Across 7,706 at-bats, Williams walked 2,019 times and struck out 709 times. That is not a normal ratio. The on-base percentage — the share of plate appearances that end with the batter reaching base safely — was .482, which means that in nearly half of all trips to the plate, he either got a hit or drew a walk. The strikeout figure is lower than the walk figure by a factor of nearly three, which describes a hitter who made the pitcher work and who did not swing at pitches outside the zone.
Two seasons are shorter than forty games
In 1952 Williams played six games. In 1953 he played thirty-seven. In 1954 he played a hundred and seventeen, and in 1955 he played ninety-eight. The season table shows the gaps, but it does not record why they happened. What the table does show is what happened when the games resumed. In 1953, across ninety-one at-bats, he hit .407 with thirteen home runs. In 1954, across a hundred and seventeen games, he hit .345 with twenty-nine home runs.
The story
On 20 April 1939 the Boston Red Sox played the New York Yankees at Yankee Stadium in front of 30,278 people. Each side made seven hits. The Yankees scored once in the second inning and once in the fifth. Boston did not score at all. The game lasted two hours and four minutes, and New York won 2–0. Williams was twenty years old.
The season table shows nineteen seasons spread across twenty-two years. The debut year was 1939; the last game was in 1960. The gap between those two dates is not continuous. In 1952 Williams played six games. In 1953 he played thirty-seven. In 1954 he played a hundred and seventeen. The table does not record the reason for the shortened seasons, only the games played. What it does show is what happened when the full schedule resumed. In 1953, across thirty-seven games and ninety-one at-bats, he hit .407 with thirteen home runs. In 1954, across a hundred and seventeen games, he hit .345 with twenty-nine home runs.
The highest batting average in the table is .406, in 1941. The lowest is .254, in 1959. The .406 season came when Williams was twenty-two. The .254 season came when he was forty. In 1960, the final season, he hit .316 with twenty-nine home runs across a hundred and thirteen games. He was forty-one.
The career totals are 2,292 games, 2,654 hits, 521 home runs, and a .344 batting average. The on-base percentage — the share of plate appearances that end with the batter reaching base safely, either by hit or by walk — was .482. That figure is the sum of two unusual numbers: 2,019 walks and 709 strikeouts. The walk total is nearly three times the strikeout total, which describes a hitter who made the pitcher work and who did not swing at pitches outside the zone. The slugging percentage — total bases divided by at-bats — was .634. The OPS, which adds on-base percentage and slugging percentage together, was 1.116.
The debut game linescore shows seven hits for each side, but the runs came in different shapes. New York scored in the second inning and the fifth. Boston's seven hits were scattered across seven different frames, which is the least efficient distribution possible. A hit with nobody on base scores nothing; a hit with two runners on scores two. The linescore does not record which batters reached base or when, but it does record that Boston made seven hits and scored no runs, which means the hits arrived at the wrong moments or were followed by outs before anyone crossed the plate.
The season table shows where the numbers rise and where they fall away. The highest home run total is forty-three, in 1949. The highest RBI total is a hundred and fifty-nine, also in 1949. The highest run total is a hundred and fifty, again in 1949. That season, Williams played a hundred and fifty-five games and walked a hundred and sixty-two times. The 1941 season, the .406 year, shows a hundred and forty-five walks and only twenty-seven strikeouts across a hundred and forty-three games. The 1950 season shows eighty-nine games, not a hundred and fifty. The 1952 and 1953 seasons show six games and thirty-seven games. The career lasted nineteen seasons across twenty-two years.
Why it mattered then
Williams played for one club across nineteen seasons, all of them for Boston. The debut came in 1939, when he was twenty, and the last game came in 1960, when he was forty-one. The season table shows nineteen seasons spread across twenty-two years, which means the career was not continuous. The 1952 season shows six games; the 1953 season shows thirty-seven. The table does not record the reasons for those shortened seasons, only the games played. The 1941 season, when Williams hit .406, sits in the season table beside a hundred and forty-five walks and only twenty-seven strikeouts. The on-base percentage that year was .551, which means that in more than half of all plate appearances, Williams either got a hit or drew a walk. The slugging percentage was .735. The OPS was 1.286. Those numbers describe a season in which the hitter reached base in more than half of his trips to the plate, and in which the hits he made were frequently extra-base hits. The 1941 season is in the record, but so is 1959, when he hit .254 across a hundred and three games at the age of forty. The career contains both.
Why it matters now
The career totals are still in the record, and the season table is still the shape it was. The .344 batting average, the .482 on-base percentage, and the 2,019 walks are figures that describe what Williams did across nineteen seasons, and they are not adjusted or weighted or projected. They are what happened. The walk-to-strikeout ratio — 2,019 walks to 709 strikeouts — is not a normal ratio, and it describes a hitter who did not chase pitches outside the strike zone and who made the pitcher work. The on-base percentage of .482 means that in nearly half of all plate appearances, Williams reached base safely. That is a rate, not a count, and it holds across 7,706 at-bats. The 1941 season, when Williams hit .406, is in the season table. The batting average that year was .406, the on-base percentage was .551, and the slugging percentage was .735. Those figures describe what happened in that season. The season table also shows 1959, when Williams hit .254 across a hundred and three games at the age of forty. Both seasons are in the record. The career lasted nineteen seasons across twenty-two years, and the gaps in the middle are visible in the season table. The 1946 season, which followed a gap of several years, shows a hundred and fifty games, a .342 average, and thirty-eight home runs. The career is a record of what one player did across two decades, and it includes the shortened seasons as well as the full ones.
The surprising detail
The 1941 and 1959 seasons sit oddest together. In 1941 Williams hit .406 with thirty-seven home runs and a hundred and forty-five walks across a hundred and forty-three games. In 1959 he hit .254 with ten home runs and fifty-two walks across a hundred and three games. The first season came when he was twenty-two; the second came when he was forty. The career contains both, and the season table does not apologise for the .254 year or treat it as a footnote. It is there in the record, and it describes what a forty-year-old hitter looks like when the skills have begun to erode. The 1960 season, the final one, shows a .316 average and twenty-nine home runs across a hundred and thirteen games, which means the 1959 season was not the end. But the table holds the .254 year alongside the .406 year, and that is the honest shape of a long career.
What is disputed
Every figure here comes from the MLB Stats API. Statistical categories were not all recorded consistently across the nineteen seasons covered, particularly for the earlier years, and some records for those seasons were compiled retrospectively from contemporary scoring. The totals are the ones the league publishes today rather than anything independently recomputed here. The season table shows shortened seasons in 1952 and 1953 but does not record the reasons for them; published sources outside this dataset attribute the gaps to military service, but that detail is not in the statistical record itself.
Remember this
A .344 average across nineteen seasons, with gaps in the middle and a final season at age forty-one.
Test yourself
Boston and New York each made seven hits in the debut game, and New York won 2–0. Using only the linescore, what explains why Boston did not score?
Distribution and timing. The runs-by-inning line shows that Boston scored in zero of the nine innings, which means the seven hits were scattered rather than clustered. New York scored once in the second and once in the fifth, which suggests their hits arrived with runners on base or were followed by additional hits in the same inning. Boston's seven hits, spread across different frames, did not cluster into rallies. A hit with nobody on base scores nothing unless it is followed by more hits in the same inning. The linescore does not say which innings Boston's hits came in, but it does show that none of those hits led to runs, which means they were either scattered across different innings or were followed by outs before anyone crossed the plate. Equal hit totals do not mean equal innings.
Go deeper
- Ted Williams — MLB Stats API player record · MLB Advanced Media
- Ted Williams — career hitting totals (MLB Stats API) · MLB Advanced Media
- Debut game linescore — MLB Stats API game 116649 · MLB Advanced Media
- Ted Williams — Wikidata · Wikidata
Image: Unknown author, Public domain. Licence: Public domain. Source.