IV · THE GAME · MAJOR LEAGUE BASEBALL
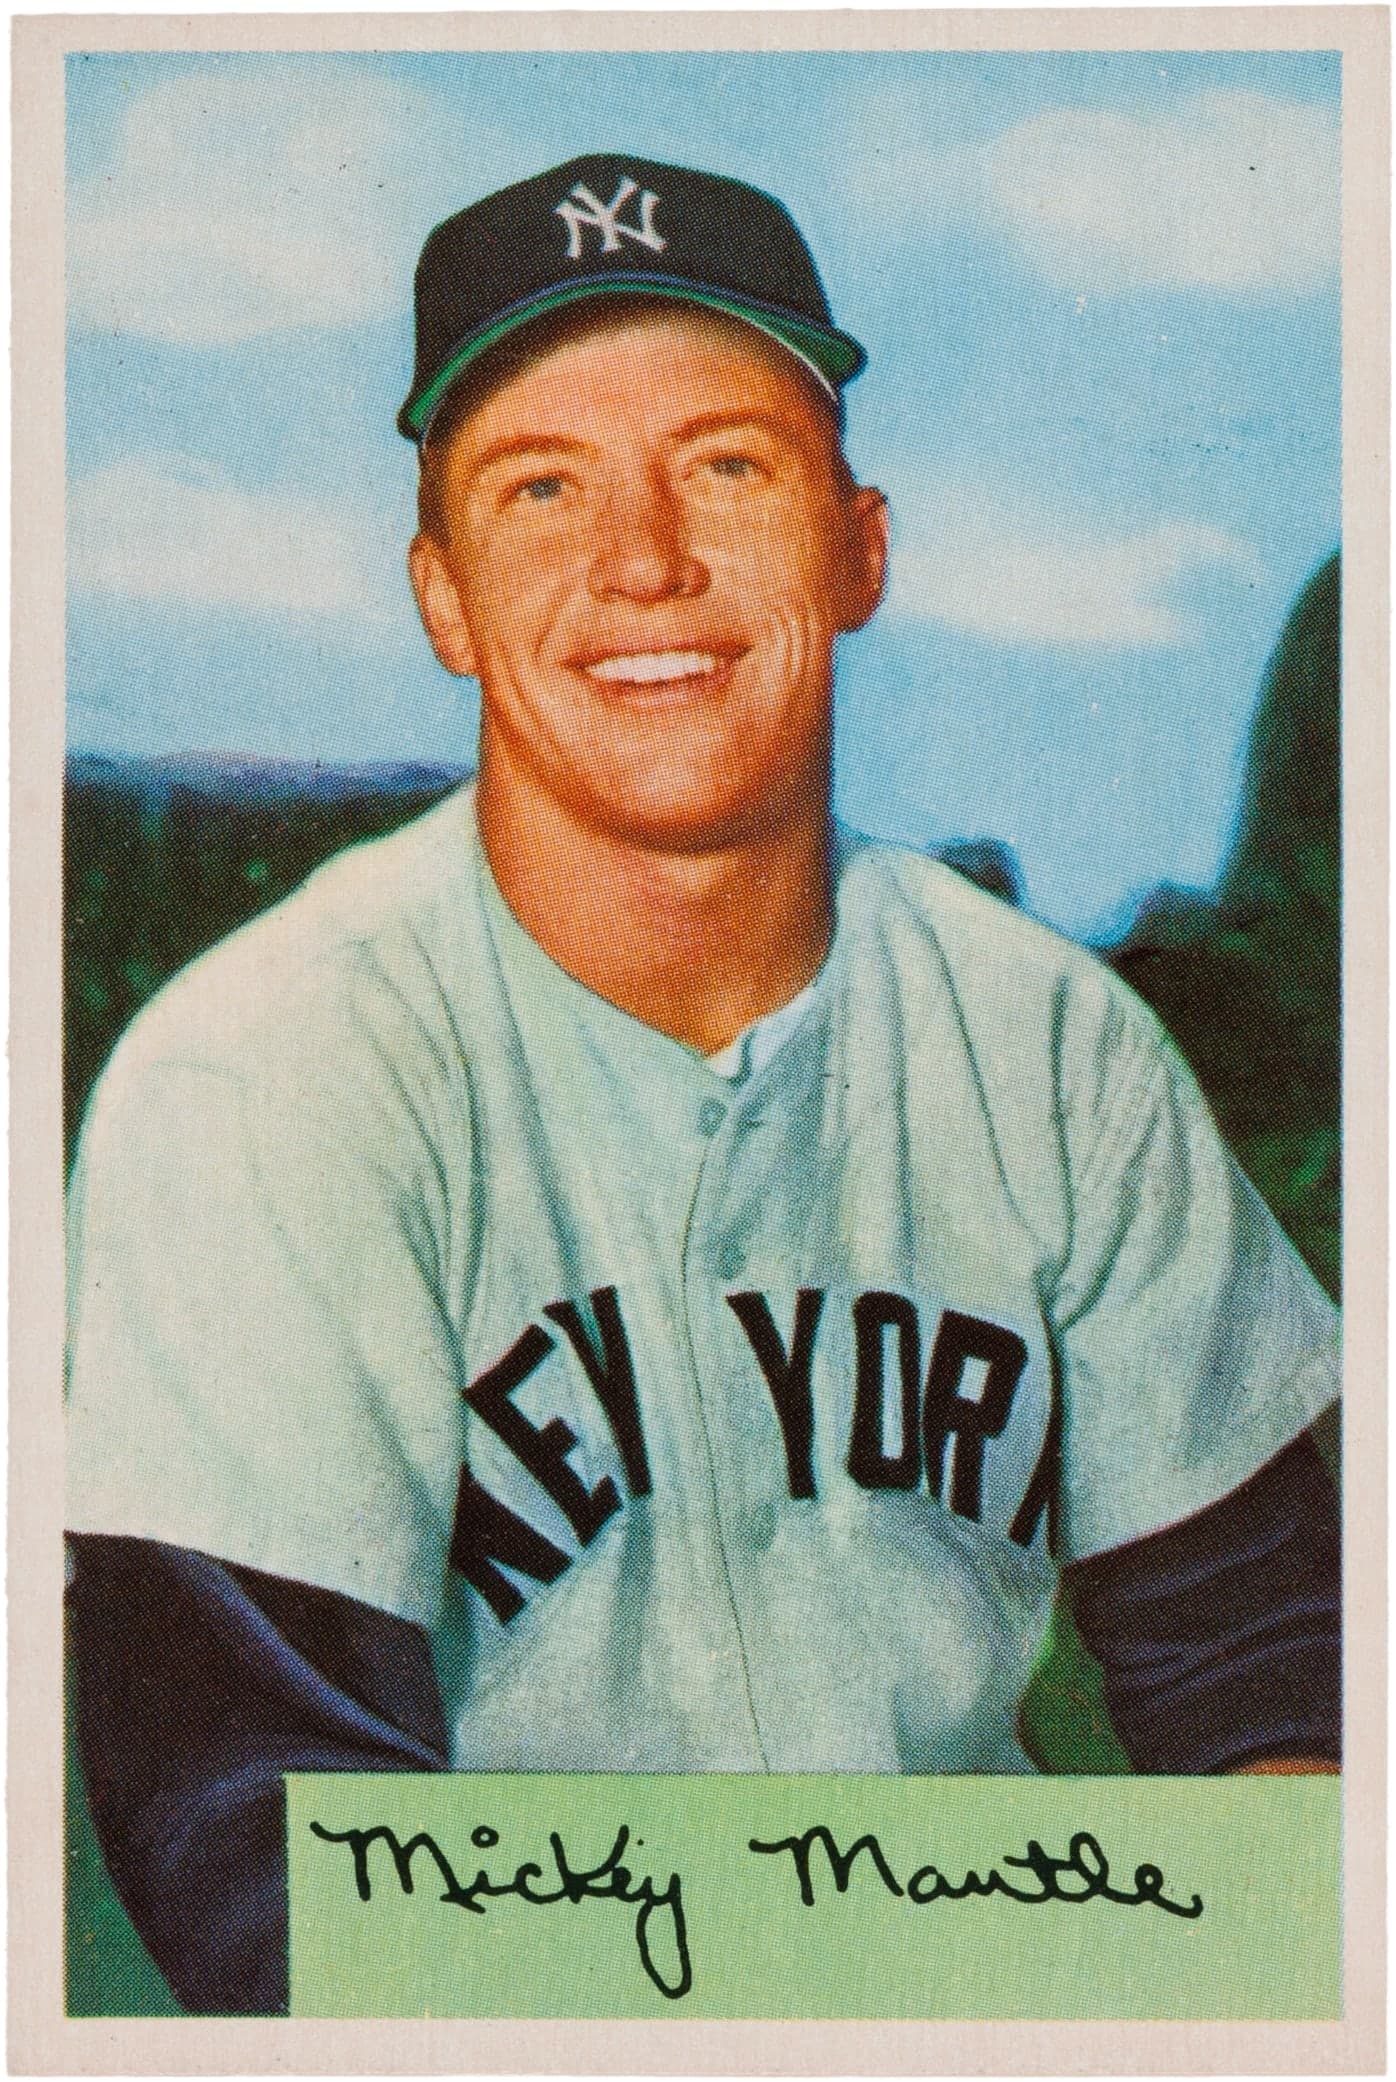
Mickey Mantle
A career read forwards is a climb and a long descent. Read backwards from the final line — .237, eighteen home runs, a hundred and forty-four games — the same numbers become unlikely.
At a glance
- Career
- 2,401 games · 2,415 hits · 536 home runs · 1,509 runs batted in · .298 average
- Debut
- 17 April 1951, aged 19, at Yankee Stadium
- Last game
- 28 September 1968, for the New York Yankees
- Nickname
- The Commerce Comet
Look closer
The debut was a shutout decided in two innings
On 17 April 1951 the Yankees made seven hits to Boston's six, committed no errors to Boston's one, and won 5–0. All five runs arrived in two innings: two in the third, three in the sixth. Boston never scored, which is why the ninth inning shows 0/- rather than 0/0 — the home side does not bat when it is already ahead. The whole thing took two hours and twelve minutes in front of 44,860 people.
The highest single-season total sits in the middle of the table
In 1956 Mantle hit fifty-two home runs across a hundred and fifty games, a .353 average, and an on-base-plus-slugging figure of 1.169. The following season he hit thirty-four home runs, batted .365, and posted an OPS of 1.177 — fewer home runs, a higher average, nearly the same combined measure. The peak is not a single cell but a plateau: 1955 through 1961 all show an OPS above 1.000, and four of those seasons are above 1.100.
Games played falls sharply after 1964
From 1951 through 1961, Mantle played at least 142 games in ten of eleven seasons. The exception is 1963: sixty-five games, a hundred and seventy-two at-bats, fifteen home runs. From 1965 onward the totals are 122, 108, 144, 144 — he returned to a full schedule twice, but the at-bats in those final two seasons are 440 and 435, well below the 514 to 549 he recorded in the early 1950s and the 500-plus range of the late fifties.
The story
On 17 April 1951 the Boston Red Sox came to Yankee Stadium and made six hits without scoring a run. The Yankees made seven and won 5–0, all five runs arriving in two innings. The game took two hours and twelve minutes. Mickey Mantle, nineteen years old and appearing in his first major-league game, was in the lineup.
That first season he played ninety-six games, batted .267, and hit thirteen home runs. The following year he played a hundred and forty-two games and hit twenty-three. In 1953 he hit twenty-one. The climb was not steep, and the early totals give no hint of what the middle years would look like.
In 1955 he hit thirty-seven home runs and posted an on-base-plus-slugging figure — OPS, a combined measure of getting on base and hitting for power — of 1.042. In 1956 he hit fifty-two and posted 1.169. In 1957 he hit thirty-four, batted .365, and posted 1.177. The home-run total fell but the average rose and the OPS stayed nearly level. From 1955 through 1961 his OPS was above 1.000 in each season and above 1.100 in four of them. The fifty-two home runs in 1956 are the highest single-season figure in the table, but they sit inside a span of years rather than standing alone.
In 1962 he played a hundred and twenty-three games. In 1963 he played sixty-five — the fewest of his career — and recorded a hundred and seventy-two at-bats. He returned to longer schedules: a hundred and forty-three games in 1964, a hundred and forty-four in both 1967 and 1968. But the at-bats in those final two full seasons were 440 and 435, well below the 514 to 549 he posted in the early 1950s and the 500-plus figures of the late fifties. He was playing, but not as often within each game.
The final line is 1968: a hundred and forty-four games, 435 at-bats, eighteen home runs, a .237 average, an OPS of .783. It is the lowest average and the lowest OPS in the table. The career lasted eighteen seasons, all with the Yankees, and the shape it makes is a long rise to a high middle and a longer descent.
Why it mattered then
The career unfolded across eighteen seasons with the Yankees, from 1951 through 1968. Mantle was a switch-hitter — batting left-handed against right-handed pitchers and right-handed against left-handed ones — who played centre field and whose presence in the lineup was a constant across that span. The middle years, 1955 through 1961, show the highest combined measures of getting on base and hitting for power, and the fifty-two home runs in 1956 came during a stretch when those figures remained consistently high. The numbers mattered because they arrived inside a single club across nearly two decades.
Why it matters now
The shape of the career — a long middle at a high level, then a visible decline across several seasons rather than an abrupt end — is a shape that matters to how careers are measured and compared. Mantle played eighteen seasons, and the final four show falling averages and falling OPS figures, but he kept playing. The question of when to stop, and what the late seasons do to the cumulative totals, is a question every long career raises. His 536 home runs were accumulated across the full span, including the years when the rate slowed. The total is not just a count but also a length of time, and the time includes the descent as well as the peak.
The surprising detail
The two seasons with the highest OPS — a combined measure of getting on base and hitting for power — are not the two seasons with the most home runs. In 1956 Mantle hit fifty-two home runs and posted an OPS of 1.169. In 1957 he hit thirty-four and posted 1.177. The home-run total fell by eighteen, but the batting average rose from .353 to .365 and the on-base percentage rose from .464 to .512. The result is a higher combined figure in the season with fewer home runs. The highest single number in one category does not always produce the highest combined measure.
What is disputed
All figures come from the MLB Stats API, which compiles statistics recorded during each season. Scoring conventions and the categories tracked have changed over time, and some early records were reconstructed from contemporary box scores rather than recorded in a unified system. The totals here are those the league publishes today.
Remember this
Fifty-two home runs in 1956, thirty-four in 1957, and a higher OPS in the second season: the peak was a plateau, not a single year.
Test yourself
In the debut game the Yankees scored five runs on seven hits, Boston scored none on six. Both totals are close, but the result was a shutout. Using only the linescore, what explains the difference?
Timing and errors. The Yankees' five runs all arrived in two innings — two in the third, three in the sixth — while Boston's six hits were spread across the game without producing a run. The Yankees committed no errors; Boston committed one. A single error can turn a hit into an extra base or a runner into a run, and when the margin is five to zero, that difference compounds. Clustered hits score runs; scattered hits strand runners. The linescore shows the runs arriving in bursts for one side and not at all for the other, and that pattern — not the total number of hits — is what determined the outcome.
Go deeper
- Mickey Mantle — MLB Stats API player record · MLB Advanced Media
- Mickey Mantle — career hitting totals (MLB Stats API) · MLB Advanced Media
- Debut game linescore — MLB Stats API game 131490 · MLB Advanced Media
- Mickey Mantle — Wikidata · Wikidata
Image: Bowman, Public domain. Licence: Public domain. Source.