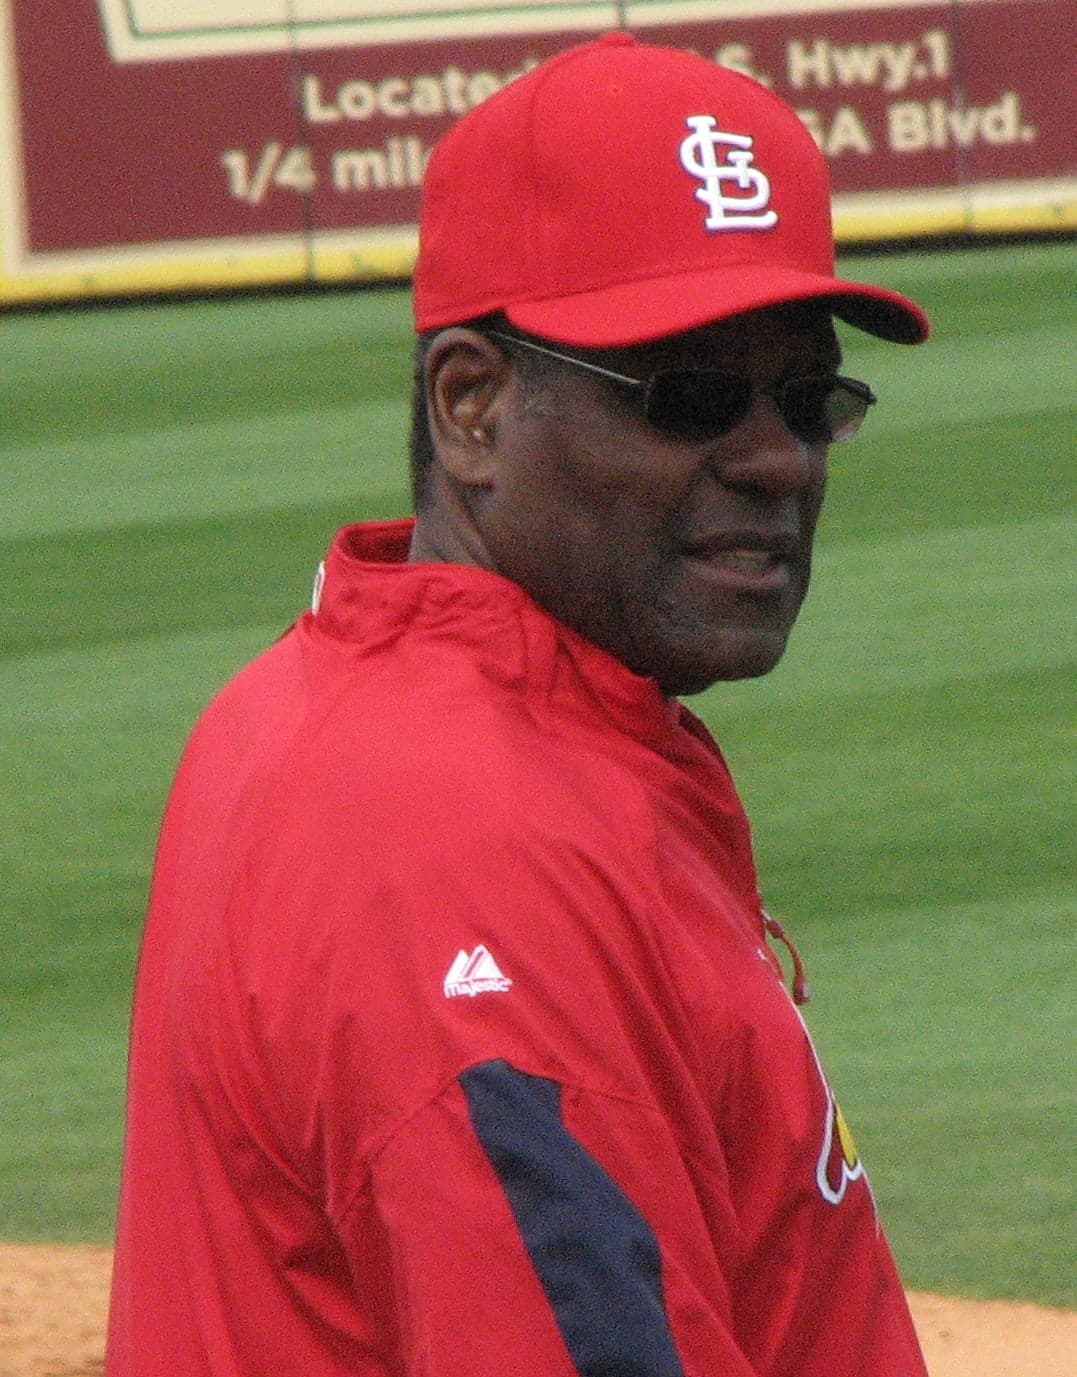
IV · THE GAME · MAJOR LEAGUE BASEBALL
Bob Gibson
One season can make a career look lopsided. Gibson's seventeen years add up to a 2.91 earned run average — solid, durable work. Then 1968 sits in the middle of it, alone.
At a glance
- Career
- 528 games · 251 wins · 174 losses · 3,117 strikeouts · 2.91 ERA
- Debut
- 15 April 1959, aged 23, at Los Angeles Memorial Coliseum
- Last game
- 3 September 1975, for the St. Louis Cardinals
- Complete games
- 255 of 482 starts · 56 shutouts
Look closer
The debut was a shutout, but not his
On 15 April 1959 the Cardinals made eight hits to the Dodgers' nine, committed no errors to the Dodgers' two, and lost 5–0. The runs came one or two at a time across four separate innings — the fourth, sixth, seventh and eighth — and Los Angeles never batted in the ninth because the home side does not bat when it is already ahead. The game lasted two hours and fourteen minutes in front of 14,491 people.
The 1968 season sits alone in the table
That year he started thirty-four games, finished twenty-eight of them, threw three hundred and four innings, struck out two hundred and sixty-eight batters, walked sixty-two, and allowed thirty-eight earned runs. The earned run average — earned runs per nine innings — works out to 1.12. The next-lowest mark in any other season is 2.18, in 1969. Every other year is above 2.44. The gap between 1968 and the rest of the career is wider than the gap between 2.18 and 3.39.
Complete games fell away sharply in the last three seasons
From 1961 through 1973 he finished between ten and twenty-eight of his starts each year. In 1974 he completed nine of thirty-three starts. In 1975 he completed one of fourteen. The innings per start tell the same story: in 1973 he averaged 7.8 innings per start, in 1974 it was 7.3, and in 1975 it was 7.8 again — but he started only fourteen games that year, down from twenty-five and thirty-three. The total innings pitched dropped to 109, the lowest since his debut season.
The story
On 15 April 1959, a Wednesday night at the Los Angeles Memorial Coliseum, the St. Louis Cardinals made eight hits and scored none of them. The Dodgers made nine hits, committed two errors to the Cardinals' none, and won 5–0. The runs arrived in four separate innings — two in the fourth, one each in the sixth, seventh and eighth — and the Dodgers never batted in the ninth because the home side does not bat when it is already ahead. The whole thing took two hours and fourteen minutes in front of 14,491 people.
That was the debut. The career that followed lasted seventeen seasons, all with the Cardinals, and added up to five hundred and twenty-eight games, four hundred and eighty-two of them starts. He won two hundred and fifty-one, lost one hundred and seventy-four, struck out three thousand one hundred and seventeen batters, walked one thousand three hundred and thirty-six, and pitched three thousand eight hundred and eighty-four innings. The earned run average across all of it was 2.91 — earned runs allowed per nine innings — and the WHIP, which counts walks and hits per inning pitched, was 1.19. He finished two hundred and fifty-five of those starts, fifty-six of them shutouts.
The season table shows a career that built slowly, held steady for more than a decade, then fell away. In 1959 he started nine games and won three. In 1960 he started twelve, won three again, and posted an earned run average of 5.61. By 1961 he was starting twenty-seven games and winning thirteen. From 1962 through 1972 he won between thirteen and twenty-three games each year, struck out between one hundred and forty-seven and two hundred and seventy-four batters, and completed between ten and twenty-eight starts. The earned run average in that span ranged from 1.12 to 3.39.
Then the numbers changed. In 1973 he started twenty-five games, won twelve, and completed thirteen. In 1974 he started thirty-three, won eleven, and completed nine. In 1975 he started fourteen, won three, and completed one. The earned run average rose to 5.04, the walks rose to sixty-two in one hundred and nine innings, and the last game came on 3 September 1975.
One season stands apart from all the others. In 1968 he started thirty-four games, finished twenty-eight of them, threw three hundred and four innings, struck out two hundred and sixty-eight batters, walked sixty-two, allowed one hundred and ninety-eight hits, and gave up thirty-eight earned runs. The earned run average was 1.12. The next-lowest mark in any other season is 2.18, in 1969. Every other year is above 2.44. The gap between 1968 and the rest of the career is wider than the gap between 2.18 and 3.39.
Why it mattered then
The 1968 season arrived in a moment when pitching across the league was dominant enough that the rules were changed the following year. The mound was lowered and the strike zone was narrowed, both adjustments designed to help hitters. Gibson's 1.12 earned run average that year was not an isolated phenomenon — it was the sharpest expression of a league-wide imbalance. The complete-game totals in the middle of his career — twenty-eight in 1968, twenty-eight again in 1969, twenty-three in 1970, twenty in 1971 — reflect a different expectation of what a starting pitcher was meant to do. A starter was expected to finish what he began, and Gibson finished two hundred and fifty-five of four hundred and eighty-two starts across seventeen seasons.
Why it matters now
The complete-game figures make the clearest contrast with current practice. In 1968 Gibson finished twenty-eight of thirty-four starts. In 1969 he finished twenty-eight of thirty-five. Across the major leagues in recent seasons, complete games by any pitcher in any game have become rare enough that a single one is noteworthy. The role of the starting pitcher has narrowed: fewer innings per start, more reliance on relief pitchers, more attention to pitch counts and rest. Gibson's career sits on the far side of that shift. The fifty-six shutouts and two hundred and fifty-five complete games describe a version of the position that no longer exists in quite the same form. The 1968 season remains a reference point because the gap between it and everything else — including the rest of Gibson's own career — is so wide that it makes the season difficult to interpret. Was it an outlier, or was it the clearest expression of what he could do when circumstances aligned?
The surprising detail
The 1968 season is so far removed from the rest of the career that it looks like a different pitcher. The earned run average of 1.12 is less than half the 2.18 mark in 1969. The career earned run average is 2.91, which means 1968 is 1.79 runs per nine innings better than the career average — a gap larger than the difference between the career average and a merely good season. The thirteen shutouts in 1968 are more than twice the six in 1965. The WHIP of 0.85 in 1968 is the only season below 1.00; every other year is 1.03 or higher. One way to read this is that 1968 was an aberration. Another is that it was the only season in which everything worked at once — command, stamina, the mound height, the strike zone, the league-wide conditions — and the rest of the career is what happened when one or more of those factors was missing.
What is disputed
The career totals and season-by-season figures come from the MLB Stats API, which compiles records from contemporary scoring. Statistical categories and recording practices were not uniform across all seventeen seasons, and some figures — particularly for the earlier years — were compiled retrospectively. The totals given here are the ones the league publishes today.
Remember this
Seventeen seasons, a 2.91 earned run average, and one year — 1.12 in 1968 — that makes the rest of the career look ordinary by comparison.
Test yourself
Gibson's 1968 season shows an earned run average of 1.12 across 304.2 innings. His 1969 season shows a 2.18 ERA across 314 innings. Which year saw more total earned runs allowed, and by how much?
1969 saw more earned runs allowed: seventy-six, compared to thirty-eight in 1968. That is exactly twice as many, even though 1969 had only nine more innings pitched. The earned run average is earned runs per nine innings, so a lower ERA does not always mean fewer total runs — it means fewer runs relative to the innings pitched. In 1968 Gibson allowed 38 earned runs in 304.2 innings, which works out to 1.12 per nine. In 1969 he allowed 76 earned runs in 314 innings, which works out to 2.18 per nine. The 1969 season was longer and the rate was higher, so the total earned runs doubled.
Go deeper
- Bob Gibson — MLB Stats API player record · MLB Advanced Media
- Bob Gibson — career pitching totals (MLB Stats API) · MLB Advanced Media
- Debut game linescore — MLB Stats API game 141416 · MLB Advanced Media
- Bob Gibson — Wikidata · Wikidata
Image: Monowi, CC BY-SA 3.0. Licence: CC BY-SA 3.0. Source.