IV · THE GAME · MAJOR LEAGUE BASEBALL
Randy Johnson
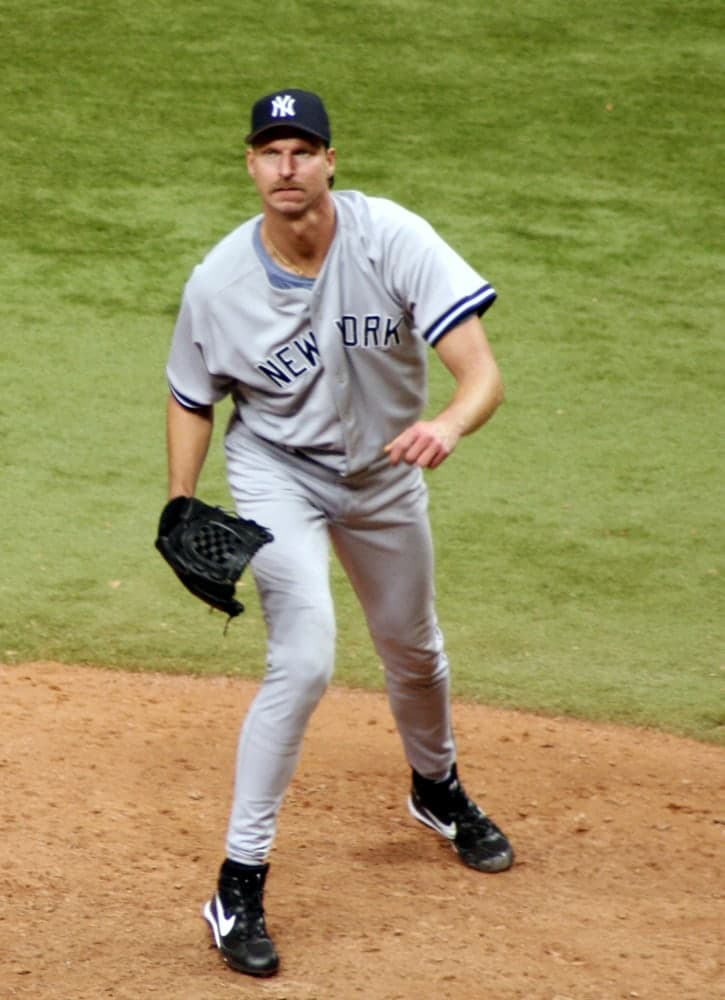
A left-handed pitcher standing six foot ten releases the ball several feet closer to third base than a right-hander of average height. The geometry alone was trouble.
At a glance
- Career
- 618 games · 303 wins · 166 losses · 4,875 strikeouts · 3.29 ERA
- Height and throws
- 6' 10" · throws left · bats right
- Debut
- 15 September 1988, aged 25, at Olympic Stadium, Montreal
- Last game
- 4 October 2009, for the San Francisco Giants
Look closer
The debut was a rout, and Montreal made no errors
On 15 September 1988 Pittsburgh and Montreal each made eleven hits, but Montreal won 9–4. The difference was not in the hitting but in the fielding and the timing: Pittsburgh made one error to Montreal's none, and Montreal's runs arrived in two clusters — three in the third inning and three more in the fifth — while Pittsburgh's were scattered across four separate innings. Equal hits do not mean equal scoring when one side puts three runners across in a single frame and the other manages only one at a time. The game took two hours and forty-six minutes in front of 9,494 people.
The walk total dropped by more than a hundred in a single season
In 1991 Johnson walked 152 batters in 201.1 innings. In 1992 he walked 144 in 210.1 innings — still high, but spread across more work. Then in 1993 the number fell to 99 walks in 255.1 innings, a drop of forty-five walks while pitching forty-five more innings. The ratio changed sharply: from roughly seven walks per nine innings in 1991 to fewer than four per nine in 1993. The strikeouts rose at the same time, from 228 to 308, which means the pitches were finding the zone more often and missing bats when they did.
Four seasons with more than three hundred strikeouts
In 1993 Johnson struck out 308 batters. In 1999 the total was 364, in 2000 it was 347, and in 2001 it reached 372. No other season in the table crosses three hundred. Those four seasons were not consecutive — 1998 sits between the first and the later three, with 329 strikeouts across two clubs — but they cluster in the middle of the career, between the ages of twenty-nine and thirty-seven. The totals in the seasons before 1993 and after 2002 are lower, which is what you would expect from a pitcher in his early twenties or his late thirties.
The story
On 15 September 1988 Randy Johnson started for the Montreal Expos at Olympic Stadium against the Pittsburgh Pirates. Both sides made eleven hits. Montreal won 9–4, scoring three runs in the third inning and three more in the fifth, while Pittsburgh's four runs arrived one or two at a time across four separate innings. Montreal made no errors; Pittsburgh made one. The game lasted two hours and forty-six minutes.
Johnson pitched four more times for Montreal that September, finishing the month with three wins, no losses, and an earned run average — the number of earned runs a pitcher allows per nine innings — of 2.42. The following season he appeared in seven games for Montreal and twenty-two for Seattle, to which he had been traded partway through the year. The combined 1989 line shows seven wins, thirteen losses, and an ERA of 4.82. The walk total that year was ninety-six in 160.2 innings, which works out to more than five per nine innings pitched.
The walk rate stayed high through 1992. In 1990 he walked 120 batters in 219.2 innings. In 1991 the total was 152 in 201.1 innings — more than six and a half per nine. In 1992 it was 144 in 210.1 innings. Then in 1993 the number dropped to 99 walks in 255.1 innings, and the strikeouts rose from 241 to 308. The ERA that year was 3.24, down from 3.77 the season before. He won nineteen games and lost eight.
The strikeout totals stayed above two hundred for the rest of the Seattle years and then climbed higher after he moved to Houston late in 1998 and to Arizona the following season. In 1999 he struck out 364 batters in 271.2 innings. In 2000 the total was 347 in 248.2 innings. In 2001 it was 372 in 249.2 innings, and in 2002 it was 334 in 260 innings. Those are the highest strikeout totals in the table, coming between the ages of thirty-five and thirty-eight.
After 2002 the innings per season began to fall. In 2003 he pitched 114 innings across eighteen starts. In 2004 the total was 245.2 innings across thirty-five starts, but in 2005, now with the New York Yankees, it was 225.2, and in 2006 it was 205. He returned to Arizona in 2007 and pitched fifty-six and two-thirds innings across ten starts, then 184 innings in 2008. His last season was 2009 with the San Francisco Giants: ninety-six innings across twenty-two games, seventeen of them starts.
The career total is 4,135.1 innings pitched across 618 games, 603 of them starts. He struck out 4,875 batters and walked 1,497. The win-loss record is 303–166. The career ERA is 3.29. He threw 100 complete games and 37 shutouts — games in which the opposing side scored no runs at all. The career lasted twenty-two seasons, from 1988 to 2009.
Why it mattered then
A pitcher who stands six foot ten and throws left-handed releases the ball from a point in space that most batters have not encountered. The angle is unfamiliar, the timing is unfamiliar, and the ball arrives from closer to third base than it does from a right-hander. Right-handed batters make up the majority of any lineup, which means Johnson's natural geometry was a problem for most of the people he faced. The height also meant the ball arrived on a steeper downward plane than it would from a pitcher of average height. A fastball thrown by someone six foot ten does not travel on the same trajectory as one thrown by someone six feet tall, even if both pitchers release the ball at the same speed. The batter's eye expects one angle and gets another. In the early Seattle years the walk totals suggest Johnson was not yet locating the ball consistently. A pitcher who walks 152 batters in 201.1 innings — as he did in 1991 — is missing the strike zone more than six times per nine innings pitched. That rate is high enough to undermine the advantage of the strikeouts, because walks put runners on base without requiring a hit. But in 1993 the walk rate dropped by nearly half while the strikeout rate rose, which means the pitches were finding the zone and the batters were missing them. A pitcher who strikes out more than ten batters per nine innings while walking fewer than four is giving the opposing side very few opportunities to score. The seasons with more than three hundred strikeouts came between 1999 and 2002, when Johnson was pitching for Arizona. Those totals are high enough that they change the shape of a season: a lineup that strikes out three hundred and sixty times in two hundred and fifty innings is making outs at the plate rather than putting the ball in play, which means fewer hits, fewer runners, and fewer runs. A pitcher who can produce that result changes the arithmetic for the rest of the rotation and the bullpen, because the innings he pitches require less defensive work and less relief support.
Why it matters now
The career total of 4,875 strikeouts is a count of how many batters swung and missed, or watched a third strike, across twenty-two seasons. It is also a count of how many times a plate appearance ended without the ball being put into play, which means 4,875 times that the defence did not have to field a grounder, track a fly ball, or make a throw. A strikeout is the cleanest out a pitcher can record, because it removes the possibility of an error, a bad bounce, or a ball that falls between fielders. The height and the arm angle made Johnson difficult to prepare for. A batter who has spent the previous night watching video of right-handed pitchers, or who has faced three right-handers earlier in the game, has to recalibrate when a left-hander takes the mound. A left-hander who is six foot ten requires a further adjustment, because the release point is not where the batter's eye expects it to be. That adjustment takes time, and in a single plate appearance there is not much time available. The result is visible in the strikeout totals: batters were late on the fastball, early on the slider, and often missed both. The walk totals in the early years and the lower strikeout totals in the final seasons show that the career was not a straight line. In 1989 Johnson walked ninety-six batters and struck out 130 in 160.2 innings, which is a pitcher still learning to locate his pitches. In 2009 he struck out eighty-six batters in ninety-six innings, which is a pitcher at the end of his career, still effective but no longer dominant. The seasons from 1993 to 2004 are where the strikeout rate stayed consistently high and the walk rate stayed consistently low. That span is longer than many pitchers' entire careers. The durability matters as much as the peak. A pitcher who can throw two hundred innings a season for more than a decade gives his club thirty-plus starts every year, which means the rest of the rotation can be built around that certainty. The 603 starts across 618 games means Johnson was almost always a starting pitcher rather than a reliever, and the 100 complete games means he was often still pitching in the ninth inning. That workload is rare now, and it was becoming rare even in the later years of his career, as pitch counts and innings limits became more common. The totals here describe a different model of pitching, one in which a starter was expected to finish what he started.
The surprising detail
The walk total in 1991 was 152 in 201.1 innings, which works out to more than six and a half walks per nine innings pitched. That rate is high enough that it would normally disqualify a pitcher from regular work, because putting that many runners on base without a hit is unsustainable. But Johnson also struck out 228 batters that season, which works out to more than ten per nine innings. The combination — extremely high strikeouts, extremely high walks — suggests a pitcher who was throwing hard enough and missing bats often enough that the club was willing to tolerate the walks. Two years later the walk rate had dropped by more than half while the strikeout rate stayed above ten per nine. The difference between those two seasons is the difference between a pitcher with extraordinary raw ability and a pitcher who has learned to control it.
What is disputed
Every figure here comes from the MLB Stats API. Statistical categories were not all recorded consistently across the twenty-two seasons covered, and records for the late 1980s were compiled retrospectively from contemporary scoring; the totals are the ones the league publishes today rather than anything independently recomputed here.
Remember this
Six foot ten, throwing left-handed from the third-base side of the rubber: the geometry was unfamiliar for every right-handed batter who faced him, and the strikeout total shows it.
Test yourself
Johnson's strikeout total in 1993 was 308, up from 241 the previous season. His walk total dropped from 144 to 99. Using only those four numbers, what changed?
The ratio of strikeouts to walks improved sharply. In 1992 Johnson struck out 241 batters and walked 144, which is a ratio of roughly 1.7 strikeouts for every walk. In 1993 he struck out 308 and walked 99, a ratio of roughly 3.1 to one. The strikeout total rose by sixty-seven while the walk total fell by forty-five, which means more pitches were in the strike zone and more of those pitches were unhittable. A pitcher who can raise his strikeout rate and lower his walk rate in the same season has made a mechanical adjustment that improved both his control and his ability to miss bats. The 1993 season is where that adjustment becomes visible in the numbers.
Go deeper
- Randy Johnson — MLB Stats API player record · MLB Advanced Media
- Randy Johnson — career pitching totals (MLB Stats API) · MLB Advanced Media
- Debut game linescore — MLB Stats API game 196416 · MLB Advanced Media
- Randy Johnson — Wikidata · Wikidata
Image: Googie man. Licence: CC BY-SA 3.0. Source.