IV · THE GAME · MAJOR LEAGUE BASEBALL
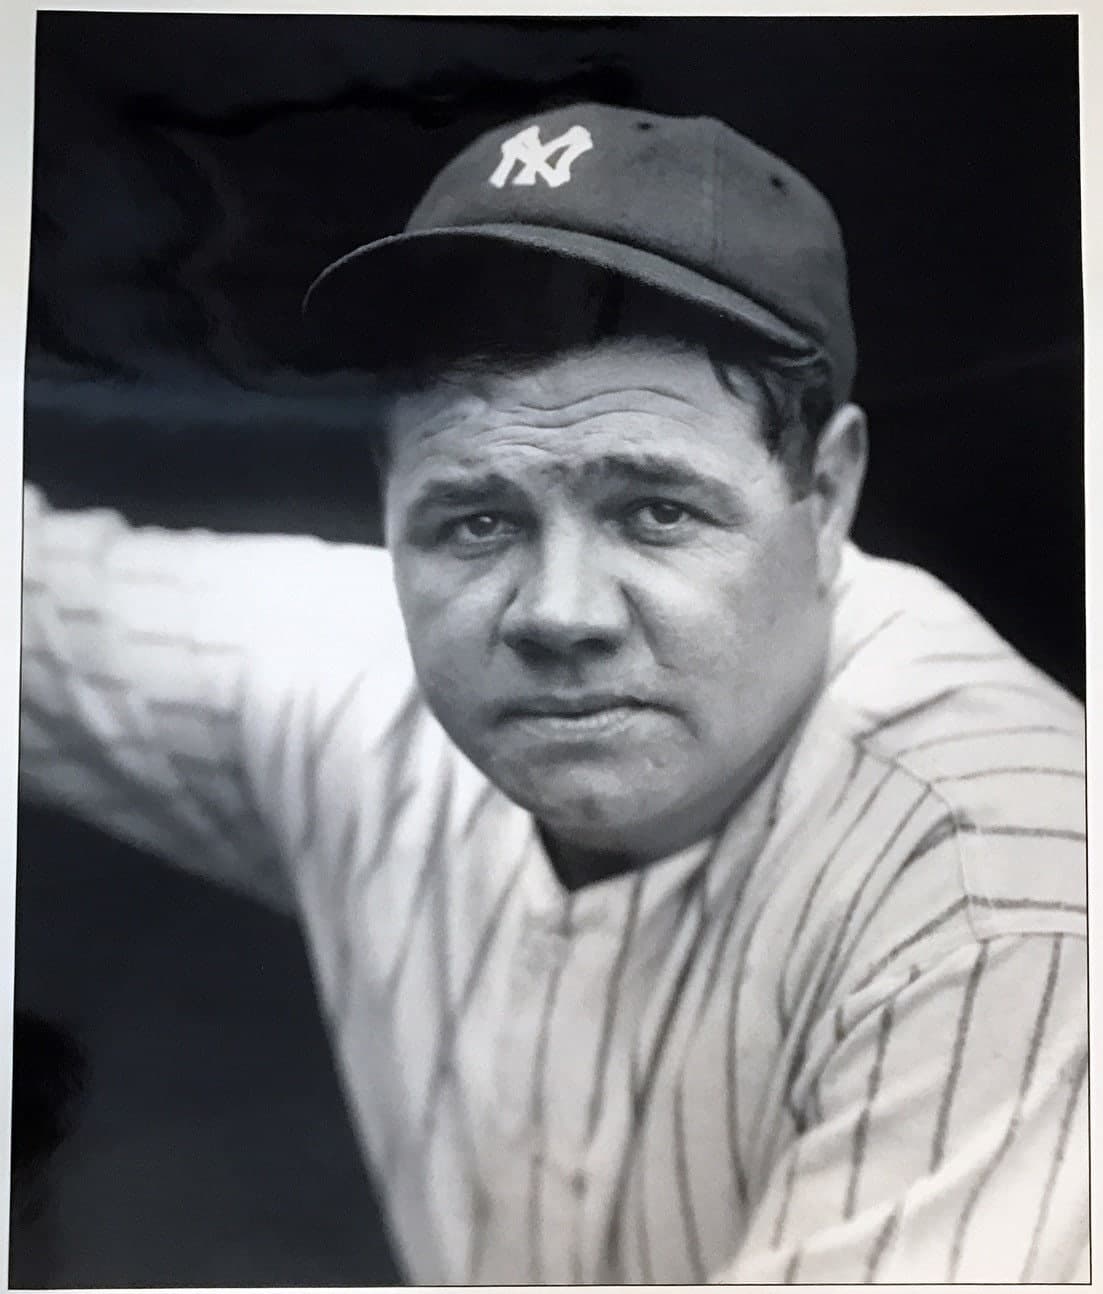
Babe Ruth
The debut was a four-to-three win at Fenway Park on 11 July 1914. The last game was twenty-one years later, in a different uniform, for a different club in a different city.
At a glance
- Career
- 2,504 games · 2,873 hits · 714 home runs · 2,213 runs batted in · .342 average
- Debut
- 11 July 1914, aged 19, at Fenway Park, Boston
- Last game
- 30 May 1935, for the Boston Braves
- Seasons
- 22 seasons, 1914–1935
Look closer
The debut was a one-run game, and the errors tell part of it
On 11 July 1914 the Cleveland Naps and the Boston Red Sox each made eight hits. Cleveland made four errors to Boston's one. Boston led 1–0 after the first inning, extended it to 3–1 in the fourth, gave up two runs in the seventh to make it 3–3, then scored once more in the bottom of the seventh to win 4–3. Cleveland never batted in the ninth, which is why that half-inning shows a dash rather than a nought. The three-error margin is exactly the size of the final score, though the linescore does not say which errors led directly to runs and which did not.
The home-run totals rise sharply, plateau, then fall away
In 1914 he hit none. In 1915, four. In 1918, eleven. In 1919, twenty-nine. In 1920 — his first season with the New York Yankees — fifty-four. The highest single-season total is sixty, in 1927. From 1920 through 1931 he hit at least forty-one every year except 1925, when he played ninety-eight games and hit twenty-five. In 1933 the total was thirty-four. In 1934, twenty-two. In 1935, six, across twenty-eight games. The career total is 714. The shape is a steep climb, a long plateau, and a short descent.
The first six seasons were thin at the plate
From 1914 through 1917 he played five, forty-two, sixty-eight, and fifty-two games. The at-bats for those four seasons sum to 361. In 1918 he played ninety-five games with 317 at-bats. In 1919, 130 games and 432 at-bats. From 1920 onwards he played more than a hundred games in every season until the final one, 1935, when he played twenty-eight. The thin early seasons suggest he was not yet a full-time position player — the material here does not say what else he was doing, but the plate appearances were not there.
The story
On 11 July 1914 the Boston Red Sox beat the Cleveland Naps 4–3 at Fenway Park. The two clubs made eight hits each. Cleveland made four errors, Boston one. Boston scored in the first inning, added two more in the fourth, gave up two in the seventh, then answered with one in the bottom of the seventh to take the lead for good. Cleveland never came to bat in the ninth, which is why the visiting half of that inning is recorded as a dash. The game was a day game, and the Red Sox won it by the margin of a single run.
The player who debuted that day played five games in 1914, with ten at-bats, two hits, and no home runs. In 1915 he played forty-two games and hit four home runs. In 1916, sixty-eight games and three home runs. The at-bat totals for those first four seasons — 1914 through 1917 — sum to 361, which is fewer than he would record in a single season starting in 1918. The thin early years suggest he was not yet playing every day, though the material here does not say what else he was doing.
In 1918 he played ninety-five games and hit eleven home runs. In 1919, 130 games and twenty-nine home runs. In 1920 — his first season with the New York Yankees — he played 142 games and hit fifty-four. That is the shape of the climb: from none in 1914 to fifty-four in 1920.
The highest single-season total is sixty, in 1927. From 1920 through 1931 he hit at least forty-one home runs every year except 1925, when he played ninety-eight games and hit twenty-five. The 1925 season stands out in the table: ninety-eight games where the surrounding years show more than a hundred, and twenty-five home runs where the surrounding years show more than forty. In 1932 he hit forty-one. In 1933, thirty-four. In 1934, twenty-two. In 1935 he played twenty-eight games for the Boston Braves — a return to Boston, but a different club — and hit six. The last game was on 30 May 1935. The career total is 714 home runs across twenty-two seasons.
The batting average for the career is .342. The on-base percentage is .474 — that is, he reached base safely in nearly half his plate appearances, counting hits and walks together. The slugging percentage is .690, which measures total bases per at-bat and reflects the frequency of extra-base hits. The season-by-season table shows the walk totals rising in step with the home runs: in 1920 he walked 150 times, in 1921, 145 times, in 1923, 170 times. Pitchers pitched around him, and the figures record it.
The career lasted twenty-two seasons by two measures: twenty-two distinct seasons in the table, and twenty-two years from debut to final game, 1914 through 1935. The club changed twice: six seasons with the Boston Red Sox, fifteen with the New York Yankees, one with the Boston Braves. The position listed is outfielder. He batted left and threw left. The career totals are 2,504 games, 2,873 hits, 714 home runs, 2,213 runs batted in.
Why it mattered then
The home-run totals that begin in 1919 and peak in 1927 arrived at a moment when the game itself was changing. The ball, the rules, the style of play — all were in flux, and the figures in the table reflect that flux whether or not the material here names the causes. A player who hit sixty home runs in a season was doing something the game had not seen in that quantity before, and the fact that he did it in 1927 and then hit fifty-four the following year means the sixty was not a fluke. The walk totals that rise alongside the home runs — 150 in 1920, 170 in 1923, 137 in 1927 and 1928 — suggest pitchers were adjusting their approach, and the on-base percentage of .474 means the adjustment did not prevent him from reaching base nearly half the time. The career unfolded in an era when the numbers themselves were being redefined, and the season-by-season table shows a player who helped define them.
Why it matters now
The career total of 714 home runs and the single-season total of sixty in 1927 have both been surpassed since, though the material here does not say by whom or when. What remains is the shape of the career: twenty-two seasons, a steep climb from 1914 to 1920, a long plateau from 1920 to 1931, and a short descent from 1932 to 1935. The batting average of .342 and the on-base percentage of .474 describe a hitter who did not merely hit home runs but hit for average and reached base at a rate that remains high by any measure. The career is a record of sustained performance across two decades, and the season-by-season table is the evidence.
The surprising detail
The first six seasons — 1914 through 1919 — account for 49 of the 714 home runs. The 1920 season accounts for 54 by itself. The material here does not say why the jump happened, but the at-bat totals tell part of the story: he played five games in 1914, forty-two in 1915, sixty-eight in 1916, fifty-two in 1917, and did not reach a hundred games until 1918. By 1920 he was playing 142 games, and the home-run total reflects the change. The distribution across the career is uneven: six thin seasons, then sixteen full ones.
What is disputed
All figures come from the MLB Stats API. Statistical categories were not recorded uniformly across the twenty-two seasons covered, and some totals — particularly for the earliest seasons — were compiled retrospectively. The totals given here are the ones the league publishes today.
Remember this
714 home runs across twenty-two seasons, with the highest single-season total being sixty in 1927. The shape of the career is a steep climb, a long plateau, and a short descent.
Test yourself
The debut game ended 4–3, with eight hits for each side. Cleveland made four errors to Boston's one. Using only the linescore, what does that three-error margin suggest about how the game was decided?
The three-error margin is exactly the size of the one-run final score, which suggests that fielding mistakes were decisive — though the linescore does not say which errors led directly to runs and which merely put runners on base. Boston scored in four separate innings, one or two runs at a time, while Cleveland scored twice in the seventh and once earlier. Equal hit totals do not mean equal innings: timing matters, and so do the errors that turn outs into baserunners. Note too that Cleveland never batted in the ninth, which is why that half-inning shows a dash: the visiting side does not bat when the home side is already ahead.
Go deeper
- Babe Ruth — MLB Stats API player record · MLB Advanced Media
- Babe Ruth — career hitting totals (MLB Stats API) · MLB Advanced Media
- Debut game linescore — MLB Stats API game 86718 · MLB Advanced Media
- Babe Ruth — Wikidata · Wikidata
Image: Charles M. Conlon, Public domain. Licence: Public domain. Source.