IV · THE GAME · MAJOR LEAGUE BASEBALL
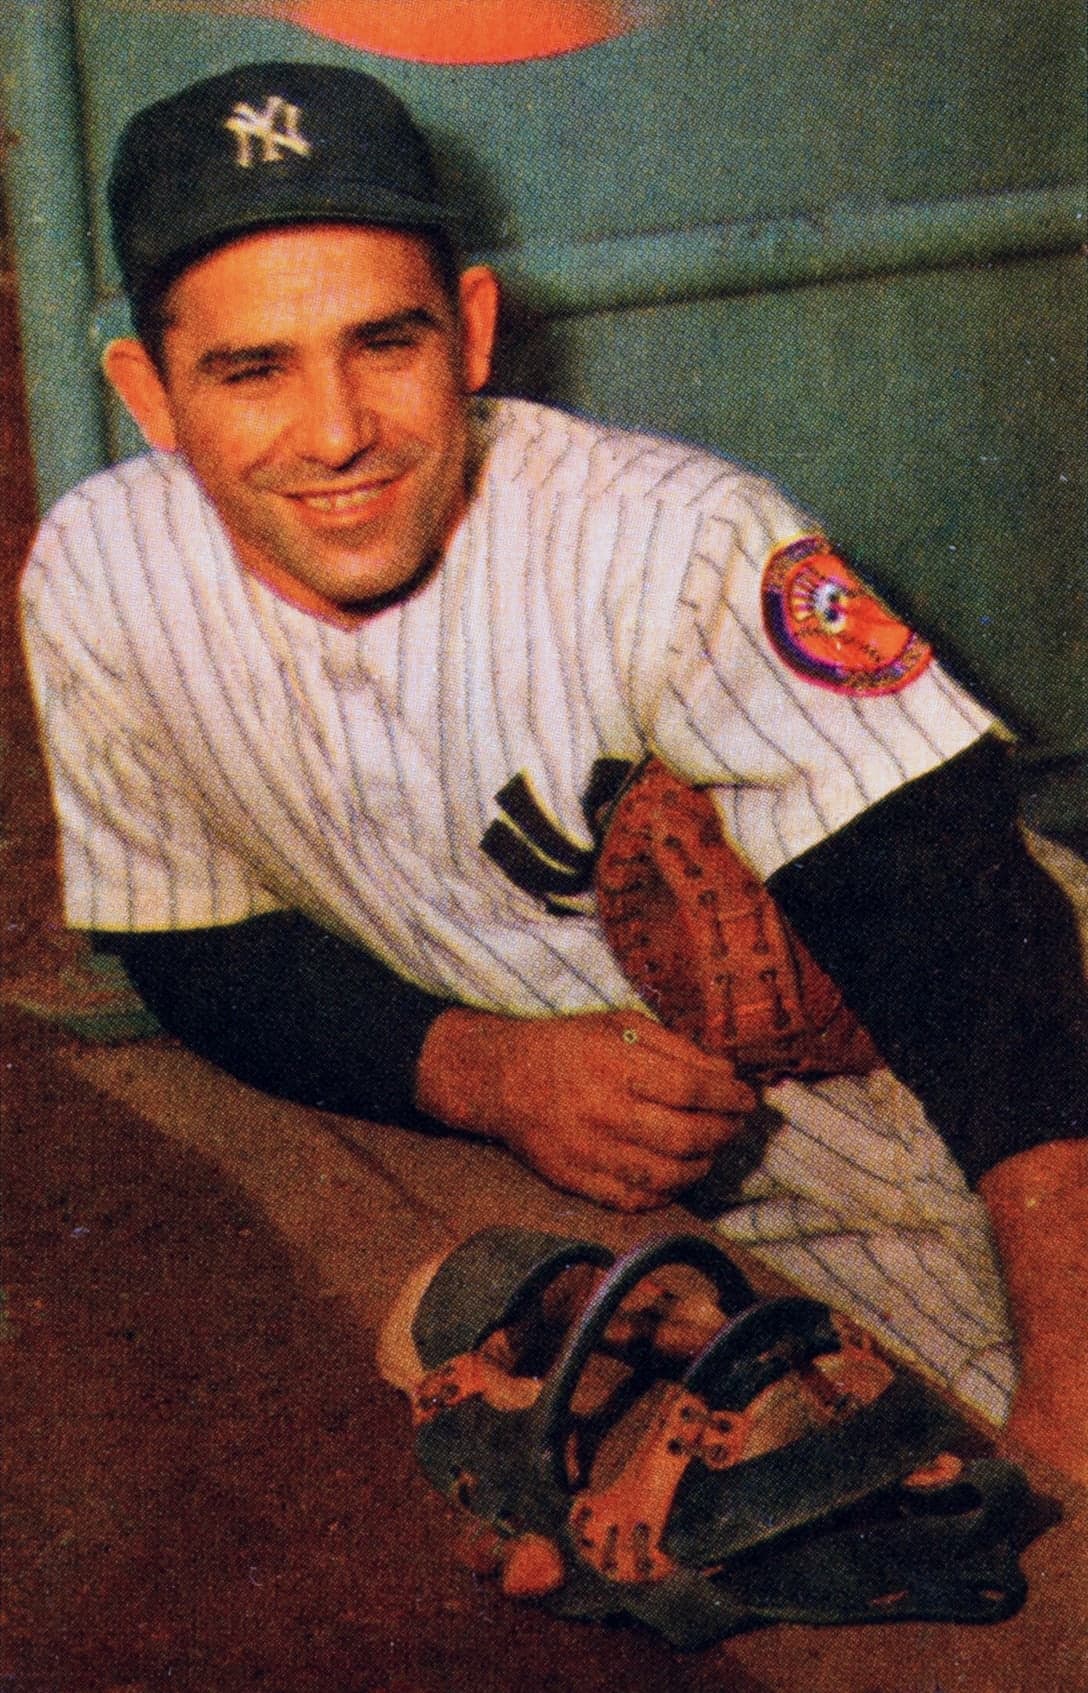
Yogi Berra
A left-handed batter who threw right is unusual enough. A catcher built that way, playing a hundred and twenty games a season for years, is rarer still.
At a glance
- Career
- 2,120 games · 2,150 hits · 358 home runs · 1,430 runs batted in · .285 average
- Debut
- 22 September 1946, aged 21, for the New York Yankees
- Last game
- 9 May 1965, for the New York Mets
- Build
- 5' 8" · 194 lb · batted left · threw right
Look closer
The 1950 season stands alone
In 1950 Berra played 151 games, made 192 hits, scored 116 runs, and drove in 124 — every one of those figures is the highest in the table. His batting average that year was .322, fifty-one points higher than the next-best season and thirty-seven points above his career mark. The on-base percentage was .383, the slugging percentage .533, and the OPS — on-base plus slugging — .916. The next-highest OPS in the table is .886 in 1953, thirty points lower. It is the only year in which every offensive category peaked at once.
Strikeouts stayed low for a decade
Between 1946 and 1956 Berra struck out fewer than thirty times in every season, and in four of those years the total was under fifteen. In 1950 he struck out twelve times in 597 at-bats, which is once every fifty trips to the plate. The rate began to climb in 1957 — thirty-five strikeouts in 1958, thirty-eight in 1959 — but even in the later seasons it never approached the totals that became common for power hitters a generation later. Over 7,555 career at-bats he struck out 414 times, or once every eighteen plate appearances.
The last two seasons are separated by a gap
Berra's second-to-last season was 1963: sixty-four games, 147 at-bats, eight home runs. Then the table skips a line. The final entry is 1965, two years later, and it records four games and nine at-bats for a different club — the New York Mets rather than the Yankees. No season appears for 1964, which means he either did not play that year or played but was not credited with a major-league at-bat. The gap is in the data, not explained by it.
The story
Berra made his major-league debut on 22 September 1946, late enough in the calendar that he played only seven games that season. In those seven he batted twenty-two times, made eight hits, and hit two home runs. The batting average for that fragment of a season was .364, the slugging percentage .682, and the OPS 1.073 — all of them the highest marks in the table, though none of them built from enough at-bats to mean what the same numbers would mean over a full year.
The 1947 season brought eighty-three games and 293 at-bats. By 1948 he was in the lineup most days — 125 games, 469 at-bats — and from 1950 through 1956 he played between 134 and 151 games every season. The at-bats in those seasons range from 482 to 597, the home runs from 22 to 30, the runs batted in from 82 to 125. The 1950 line is the peak: 151 games, 192 hits, 116 runs, .322 average, .916 OPS. Every counting category in that season is the highest in the table.
After 1956 the games-played total began to fall. In 1957 he appeared in 134 games; in 1960, 120; in 1962, 86. The 1963 season was sixty-four games and 147 at-bats, and then the table skips to 1965, when he played four games for the Mets and recorded nine at-bats. That final line is dated 9 May 1965, which was his last day in a major-league game.
The career totals are 2,120 games, 7,555 at-bats, 2,150 hits, 358 home runs, and 1,430 runs batted in. The batting average across all nineteen seasons was .285, the on-base percentage .348, the slugging percentage .482. He stole thirty bases and struck out 414 times, which over that many at-bats works out to one strikeout every eighteen trips to the plate. The debut was in 1946 and the last game in 1965, which spans twenty years, though only nineteen of them show a season in the table.
Why it mattered then
A catcher who could play a hundred and twenty games a season, year after year, was valuable for reasons that do not all show up in a batting line. The position is hard on the body — crouching, blocking pitches, taking foul tips off the mask and chest protector — and most catchers of that era did not stay in the lineup as long or as often as Berra did between 1948 and 1960. The fact that he batted left and threw right made him unusual: most catchers threw with their dominant hand, and most left-handed throwers did not catch because the geometry of the position — throwing to third base, in particular — favoured right-handers. Berra's combination of durability, bat-handedness, and offensive production made him a fixture in a Yankees lineup that won often during his tenure, though the fact sheet here records no standings, no playoff results, and no awards, so those outcomes must be left out of this account.
Why it matters now
The season-by-season table is a record of how a career is actually built: not as a single peak but as years of showing up, followed by a slow decline in games played and at-bats. The 1950 season stands out because every number that year is the highest in the table, but the career total is not the sum of one great year — it is nineteen years of twenty to thirty home runs, eighty to a hundred and twenty-five runs batted in, and a batting average that moved between .251 and .322 depending on the season. The strikeout totals, especially in the early years, show a level of contact that became rarer as the game changed: twelve strikeouts in 597 at-bats in 1950, twenty in 547 at-bats in 1951. The gap between 1963 and 1965, and the fact that the 1965 line shows a different club, suggests a late-career move or a brief return after time away, but the data here do not explain which.
The surprising detail
In 1950 Berra struck out twelve times in 597 at-bats. That is once every fifty plate appearances, or roughly once every eleven games in a season in which he played 151 of them. For context, his career strikeout total was 414 in 7,555 at-bats, which is once every eighteen trips — still low, but the 1950 rate is lower still. The same year he hit twenty-eight home runs. That means in 1950 he hit twenty-eight home runs and struck out twelve times — two and a third home runs for every strikeout.
What is disputed
The box score of Berra's first game, on 22 September 1946, is not available here, so no detail of that debut — opponent, venue, score, or inning-by-inning line — can be stated. The season-by-season table shows no entry for 1964, which means either he did not play that year or he played but was not credited with a major-league plate appearance; the data do not say which. All figures come from the MLB Stats API, which compiles records retroactively for seasons before comprehensive electronic scoring.
Remember this
Nineteen seasons, 358 home runs, and a strikeout rate that stayed below thirty a year for a decade: durability, not a single peak.
Test yourself
Berra's 1950 season is the only one in which every major offensive category peaked at once. Using the table, name three categories in which the 1950 figure is the highest in his career.
Games played: 151 in 1950, higher than any other season. Hits: 192 in 1950, well ahead of the next-highest total of 179 in 1954. Runs scored: 116 in 1950, compared to 97 in 1952, the second-highest mark. Runs batted in: 124 in 1950, but 125 in 1954 is higher, so RBI does not qualify. Batting average: .322 in 1950, fifty-one points higher than the next-best season. On-base percentage: .383 in 1950. Slugging percentage: .533 in 1950. OPS: .916 in 1950, thirty points ahead of the second-highest. So the correct answer is: games played, hits, runs scored, batting average, on-base percentage, slugging percentage, and OPS all peaked in 1950. Any three of those are correct.
Go deeper
- Yogi Berra — MLB Stats API player record · MLB Advanced Media
- Yogi Berra — career hitting totals (MLB Stats API) · MLB Advanced Media
- Yogi Berra — Wikidata · Wikidata
Image: Bowman Gum, Public domain. Licence: Public domain. Source.