IV · THE GAME · MAJOR LEAGUE BASEBALL
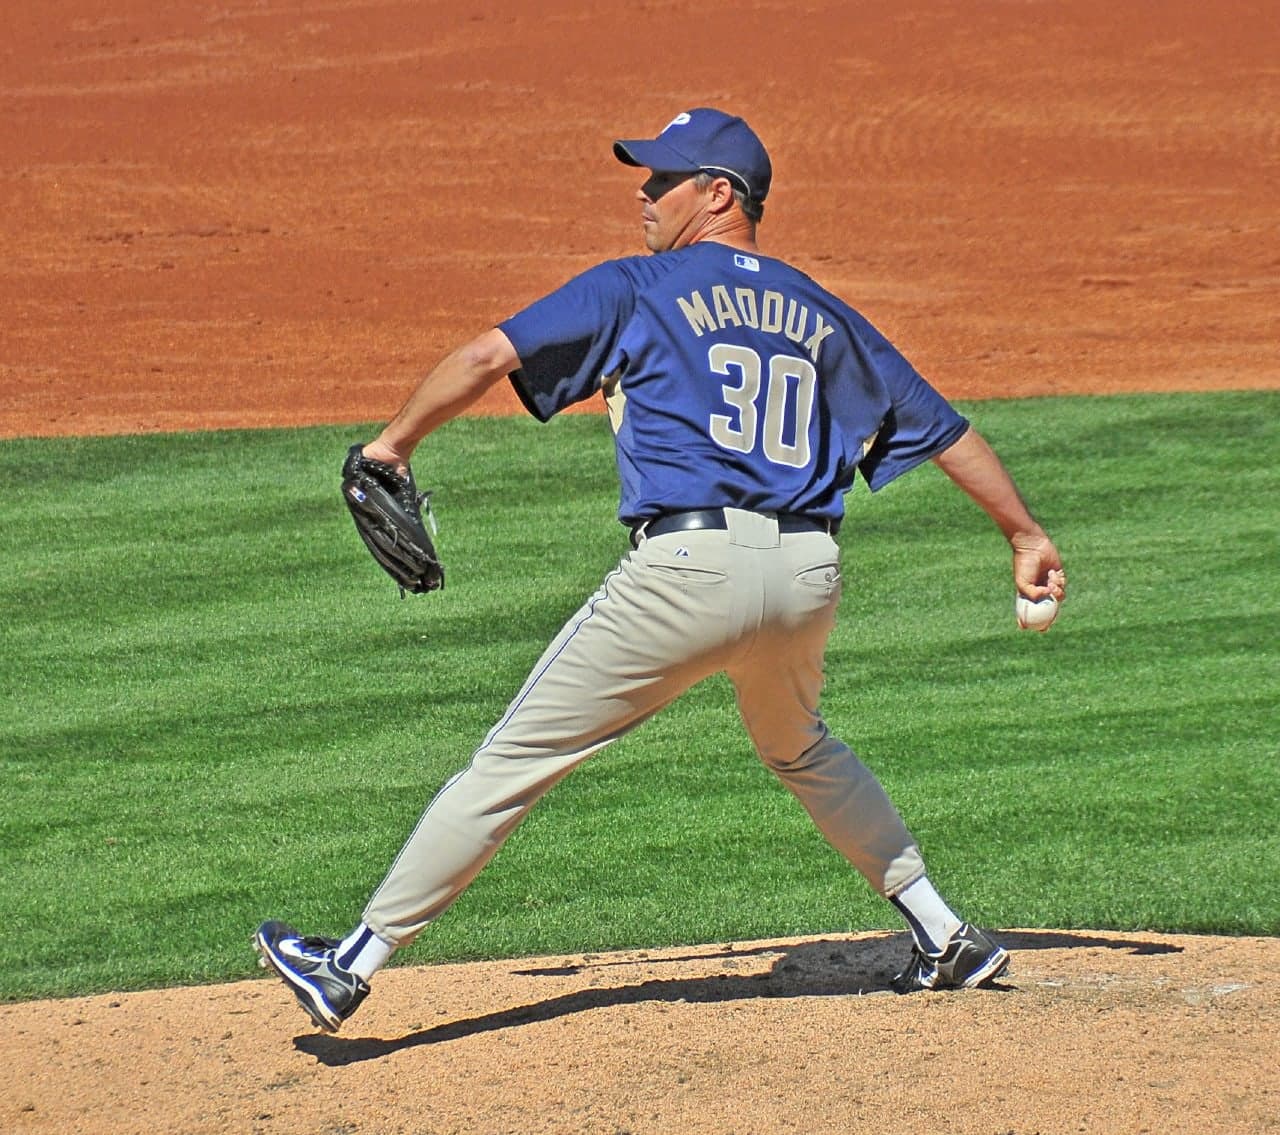
Greg Maddux
Control is harder to dramatise than velocity, but the arithmetic is plain: nine hundred and ninety-nine walks in five thousand innings is a rate most power pitchers cannot approach.
At a glance
- Career
- 744 games · 355 wins · 227 losses · 3.16 ERA · 3,371 strikeouts · 999 walks
- Debut
- 3 September 1986, aged 20, for the Chicago Cubs
- Last game
- 27 September 2008, for the Los Angeles Dodgers
- Innings pitched
- 5,008.1 innings across 23 seasons
Look closer
The walk total is the rarest figure here
Nine hundred and ninety-nine walks in five thousand and eight innings is a rate of 1.8 per nine innings. That means Maddux issued a free pass roughly once every five innings he worked. The league average for a starting pitcher is typically above three walks per nine innings, and power pitchers — those who rely on velocity and miss bats — often walk four or more. The gap between 1.8 and 4.0 is the gap between two different approaches to getting outs: one built on location, the other on overpowering the hitter.
The peak years cluster in the middle, not the beginning
Maddux's earned run average in 1986 was 5.52. In 1987 it was 5.61. By 1988 it had fallen to 3.18, and by 1992 it was 2.18. The lowest mark came in 1994: 1.56, in two hundred and two innings. The next season it was 1.63. From 1992 through 1998 — seven consecutive seasons — the ERA never rose above 2.72. After 1998 it climbed steadily: 3.57 in 1999, 4.24 in 2005, 4.22 in the final season. The shape is a slow rise, a long plateau, and a slow decline. The plateau lasted longer than most pitchers' entire careers.
The complete-game total falls away after 2001
In 1994 Maddux completed ten of his twenty-five starts. In 1995 he completed ten of twenty-eight. From 1988 through 2001 he completed at least three games every season, and in six of those seasons he completed seven or more. After 2001 the total drops sharply: one in 2003, two in 2004, three in 2005, then none in the final three seasons. The change reflects a shift in how pitchers were used across the league — starting pitchers in the 2000s rarely worked past the seventh inning, even when effective — but the timing is visible in the table.
The story
The debut game is not available here, so the career begins with a line in the table: six games in 1986, five of them starts, two wins and four losses, an earned run average of 5.52. The following season was worse — thirty games, six wins, fourteen losses, an ERA of 5.61 — and then something shifted. In 1988 the ERA fell to 3.18. In 1989 it was 2.95. By 1992 it was 2.18, and in 1994 it reached 1.56 across two hundred and two innings. The walk rate fell in parallel: seventy-four walks in 1987, then eighty-one in 1988, then a steady decline to fifty-two in 1993, thirty-one in 1994, twenty-three in 1995. The lowest single-season total came in 1997: twenty walks in two hundred and thirty-two innings, a rate of 0.8 per nine innings.
The career lasted twenty-three seasons. The first seven were with the Chicago Cubs, from 1986 through 1992. In 1993 Maddux moved to the Atlanta Braves, where he stayed through 2003 — eleven consecutive seasons. He returned to the Cubs in 2004 and pitched there through part of 2006, then finished with the Los Angeles Dodgers, the San Diego Padres, and the Dodgers again, moving between clubs in 2006 and 2008. The final game was on 27 September 2008. By then the ERA had climbed back above 4.00, the strikeout rate had fallen, and the complete games had disappeared entirely.
The career totals are 744 games, 740 of them starts, 355 wins, 227 losses, and an ERA of 3.16. The strikeout total is 3,371, which is high but not extraordinary for a pitcher who worked five thousand innings. The walk total is 999, which is extraordinary: fewer than one thousand free passes in more than five thousand innings. The ratio of strikeouts to walks is 3.4 to one, meaning Maddux struck out more than three batters for every one he walked. That ratio is a measure of control, and control is what the numbers describe. He did not overpower hitters. He located pitches, changed speeds, and avoided the centre of the strike zone. The result is visible in the walk column, season after season, for more than two decades.
Why it mattered then
Maddux pitched through an era when the game was changing around him. In the late 1980s and through the 1990s, offences were strong — run-scoring was high, home runs were plentiful, and pitchers who could suppress runs were increasingly valuable. The strike zone, as called by umpires, was also in flux: it shrank through the 1990s, making it harder to throw strikes without also throwing hittable pitches. In that environment, a pitcher who could work the edges of the zone without walking batters had an advantage. Maddux's walk rate stayed low even as the league average climbed, and his ERA stayed low even as scoring rose. The Braves won their division every season from 1993 through 2003, and Maddux was the most consistent starter in that rotation for most of that stretch. The team's success and his individual performance were not independent: the Braves could rely on him to take the ball every fifth day and pitch deep into games without collapsing, which meant the bullpen was less taxed and the rest of the rotation had more margin for error.
Why it matters now
The way pitchers are used has changed since Maddux retired. Starting pitchers now rarely work past the sixth inning, even when effective, and complete games are now rare enough that a single one is noteworthy. Maddux completed 109 games in his career, including ten in 1994 and ten in 1995. The change reflects a shift in strategy: teams now believe that batters perform better the more times they see a pitcher in a single game, so even a pitcher who is working efficiently is often removed after two trips through the batting order. Maddux's career totals — the innings, the complete games, the durability — are therefore harder to replicate now than they were when he was active. The walk rate, however, remains a meaningful measure. Control is still control, and the ability to throw strikes without throwing hittable pitches is still the central problem a pitcher must solve. Maddux's solution is visible in the numbers: 999 walks in 5,008 innings, a rate that has not been matched by any pitcher with a comparable workload since.
The surprising detail
The walk total is 999, one short of a round thousand. Whether that is coincidence or the result of a deliberate choice in the final season is not recorded here, but the gap is narrow enough to notice. In 2008 Maddux issued thirty walks across 194 innings — twenty-six with San Diego, four with Los Angeles. If he had walked one more batter in either stint, the career total would have been 1,000. Instead it is 999, and the figure sits there in the table, one digit away from a milestone that would have been easier to remember but no more meaningful.
What is disputed
The box score of the debut game on 3 September 1986 is not available here, so no details of that game — opponent, venue, result, or line — are included. All career totals come from the MLB Stats API as published by MLB Advanced Media. Statistical categories were not uniformly recorded across all twenty-three seasons, and the figures here are the league's current published totals rather than independently recomputed ones.
Remember this
999 walks in 5,008 innings: control expressed as arithmetic, sustained across twenty-three seasons.
Test yourself
Maddux's ERA in 1994 was 1.56, and in 1995 it was 1.63. Both seasons are shorter than usual — 202 innings in 1994, 209.2 in 1995 — but the walk totals are also unusually low: 31 in 1994, 23 in 1995. What is the relationship between innings pitched, walks, and ERA in those two seasons?
The walk totals translate to rates of 1.4 per nine innings in 1994 and 1.0 per nine innings in 1995 — both well below Maddux's career average of 1.8, and far below the league norm. Fewer walks mean fewer baserunners, and fewer baserunners mean fewer opportunities for runs to score. The earned run totals in those two seasons are 35 and 38, respectively, which across roughly two hundred innings each yields the sub-1.70 ERAs. The seasons are shorter because 1994 was cut short by a players' strike — the season ended in August — and 1995 began late for the same reason. The innings are compressed, but the walk rate stayed low, and the result is visible in the earned run average. Control does not require a full season to show up in the numbers.
Go deeper
- Greg Maddux — MLB Stats API player record · MLB Advanced Media
- Greg Maddux — career pitching totals (MLB Stats API) · MLB Advanced Media
- Greg Maddux — Wikidata · Wikidata
Image: User ISU_79 on Flickr, CC BY 2.0. Licence: CC BY 2.0. Source.